

Westpac Group Pillar 3 Report March 2013 - Iguana IR Sites
Westpac Group Pillar 3 Report March 2013 - Iguana IR Sites
Westpac Group Pillar 3 Report March 2013 - Iguana IR Sites

Create successful ePaper yourself
Turn your PDF publications into a flip-book with our unique Google optimized e-Paper software.
PILLAR 3 REPORT<br />
CAPITAL OVERVIEW<br />
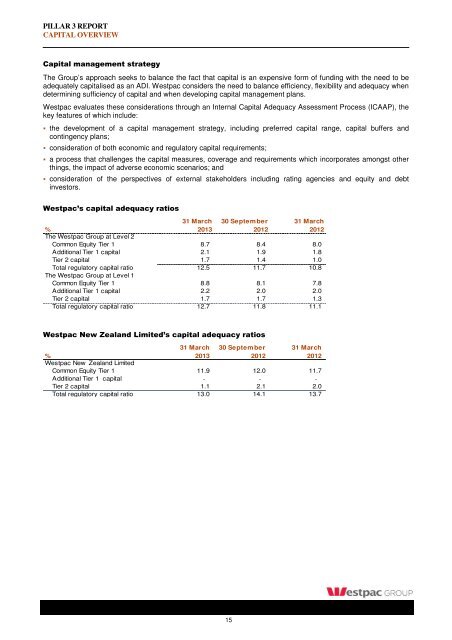
Capital management strategy<br />
The <strong>Group</strong>’s approach seeks to balance the fact that capital is an expensive form of funding with the need to be<br />
adequately capitalised as an ADI. <strong>Westpac</strong> considers the need to balance efficiency, flexibility and adequacy when<br />
determining sufficiency of capital and when developing capital management plans.<br />
<strong>Westpac</strong> evaluates these considerations through an Internal Capital Adequacy Assessment Process (ICAAP), the<br />
key features of which include:<br />
the development of a capital management strategy, including preferred capital range, capital buffers and<br />
contingency plans;<br />
consideration of both economic and regulatory capital requirements;<br />
a process that challenges the capital measures, coverage and requirements which incorporates amongst other<br />
things, the impact of adverse economic scenarios; and<br />
consideration of the perspectives of external stakeholders including rating agencies and equity and debt<br />
investors.<br />
<strong>Westpac</strong>’s capital adequacy ratios<br />
31 <strong>March</strong> 30 September 31 <strong>March</strong><br />
% <strong>2013</strong> 2012 2012<br />
The <strong>Westpac</strong> <strong>Group</strong> at Level 2<br />
Common Equity Tier 1 8.7 8.4 8.0<br />
Additional Tier 1 capital 2.1 1.9 1.8<br />
Tier 2 capital 1.7 1.4 1.0<br />
Total regulatory capital ratio 12.5 11.7 10.8<br />
The <strong>Westpac</strong> <strong>Group</strong> at Level 1<br />
Common Equity Tier 1 8.8 8.1 7.8<br />
Additional Tier 1 capital 2.2 2.0 2.0<br />
Tier 2 capital 1.7 1.7 1.3<br />
Total regulatory capital ratio 12.7 11.8 11.1<br />
<strong>Westpac</strong> New Zealand Limited’s capital adequacy ratios<br />
31 <strong>March</strong> 30 September 31 <strong>March</strong><br />
% <strong>2013</strong> 2012 2012<br />
<strong>Westpac</strong> New Zealand Limited<br />
Common Equity Tier 1 11.9 12.0 11.7<br />
Additional Tier 1 capital - - -<br />
Tier 2 capital 1.1 2.1 2.0<br />
Total regulatory capital ratio 13.0 14.1 13.7<br />
15


