

Westpac Group Pillar 3 Report March 2013 - Iguana IR Sites
Westpac Group Pillar 3 Report March 2013 - Iguana IR Sites
Westpac Group Pillar 3 Report March 2013 - Iguana IR Sites

You also want an ePaper? Increase the reach of your titles
YUMPU automatically turns print PDFs into web optimized ePapers that Google loves.
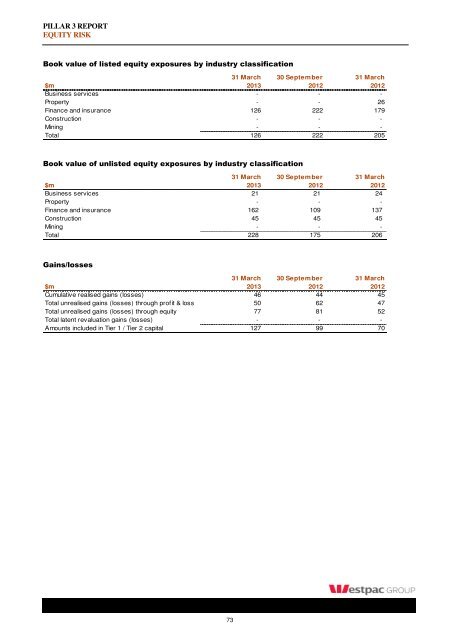
PILLAR 3 REPORT<br />
EQUITY RISK<br />
Book value of listed equity exposures by industry classification<br />
31 <strong>March</strong> 30 September 31 <strong>March</strong><br />
$m <strong>2013</strong> 2012 2012<br />
Business services - - -<br />
Property - - 26<br />
Finance and insurance 126 222 179<br />
Construction - - -<br />
Mining - - -<br />
Total 126 222 205<br />
Book value of unlisted equity exposures by industry classification<br />
31 <strong>March</strong> 30 September 31 <strong>March</strong><br />
$m <strong>2013</strong> 2012 2012<br />
Business services 21 21 24<br />
Property - - -<br />
Finance and insurance 162 109 137<br />
Construction 45 45 45<br />
Mining - - -<br />
Total 228 175 206<br />
Gains/losses<br />
31 <strong>March</strong> 30 September 31 <strong>March</strong><br />
$m <strong>2013</strong> 2012 2012<br />
Cumulative realised gains (losses) 46 44 45<br />
Total unrealised gains (losses) through profit & loss 50 62 47<br />
Total unrealised gains (losses) through equity 77 81 52<br />
Total latent revaluation gains (losses) - - -<br />
Amounts included in Tier 1 / Tier 2 capital 127 99 70<br />
73


