

Westpac Group Pillar 3 Report March 2013 - Iguana IR Sites
Westpac Group Pillar 3 Report March 2013 - Iguana IR Sites
Westpac Group Pillar 3 Report March 2013 - Iguana IR Sites

You also want an ePaper? Increase the reach of your titles
YUMPU automatically turns print PDFs into web optimized ePapers that Google loves.
PILLAR 3 REPORT<br />
CREDIT RISK EXPOSURES<br />
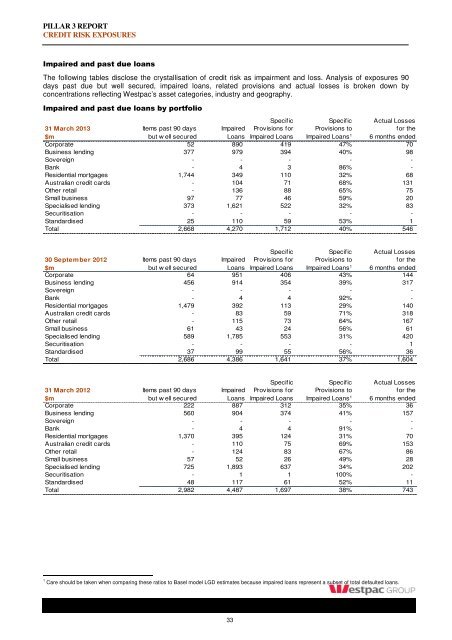
Impaired and past due loans<br />
The following tables disclose the crystallisation of credit risk as impairment and loss. Analysis of exposures 90<br />
days past due but well secured, impaired loans, related provisions and actual losses is broken down by<br />
concentrations reflecting <strong>Westpac</strong>’s asset categories, industry and geography.<br />
Impaired and past due loans by portfolio<br />
Specific Specific Actual Losses<br />
31 <strong>March</strong> <strong>2013</strong> Items past 90 days Impaired Provisions for Provisions to for the<br />
$m but w ell secured Loans Impaired Loans Impaired Loans 1 6 months ended<br />
Corporate 52 890 419 47% 70<br />
Business lending 377 979 394 40% 98<br />
Sovereign - - - - -<br />
Bank - 4 3 86% -<br />
Residential mortgages 1,744 349 110 32% 68<br />
Australian credit cards - 104 71 68% 131<br />
Other retail - 136 88 65% 75<br />
Small business 97 77 46 59% 20<br />
Specialised lending 373 1,621 522 32% 83<br />
Securitisation - - - - -<br />
Standardised 25 110 59 53% 1<br />
Total 2,668 4,270 1,712 40% 546<br />
Specific Specific Actual Losses<br />
30 September 2012 Items past 90 days Impaired Provisions for Provisions to for the<br />
$m but w ell secured Loans Impaired Loans Impaired Loans 1 6 months ended<br />
Corporate 64 951 406 43% 144<br />
Business lending 456 914 354 39% 317<br />
Sovereign - - - - -<br />
Bank - 4 4 92% -<br />
Residential mortgages 1,479 392 113 29% 140<br />
Australian credit cards - 83 59 71% 318<br />
Other retail - 115 73 64% 167<br />
Small business 61 43 24 56% 61<br />
Specialised lending 589 1,785 553 31% 420<br />
Securitisation - - - - 1<br />
Standardised 37 99 55 56% 36<br />
Total 2,686 4,386 1,641 37% 1,604<br />
Specific Specific Actual Losses<br />
31 <strong>March</strong> 2012 Items past 90 days Impaired Provisions for Provisions to for the<br />
$m but w ell secured Loans Impaired Loans Impaired Loans 1 6 months ended<br />
Corporate 222 887 312 35% 36<br />
Business lending 560 904 374 41% 157<br />
Sovereign - - - - -<br />
Bank - 4 4 91% -<br />
Residential mortgages 1,370 395 124 31% 70<br />
Australian credit cards - 110 75 69% 153<br />
Other retail - 124 83 67% 86<br />
Small business 57 52 26 49% 28<br />
Specialised lending 725 1,893 637 34% 202<br />
Securitisation - 1 1 100% -<br />
Standardised 48 117 61 52% 11<br />
Total 2,982 4,487 1,697 38% 743<br />
1 Care should be taken when comparing these ratios to Basel model LGD estimates because impaired loans represent a subset of total defaulted loans.<br />
33


