

Westpac Group Pillar 3 Report March 2013 - Iguana IR Sites
Westpac Group Pillar 3 Report March 2013 - Iguana IR Sites
Westpac Group Pillar 3 Report March 2013 - Iguana IR Sites

You also want an ePaper? Increase the reach of your titles
YUMPU automatically turns print PDFs into web optimized ePapers that Google loves.
PILLAR 3 REPORT<br />
CREDIT RISK MANAGEMENT<br />
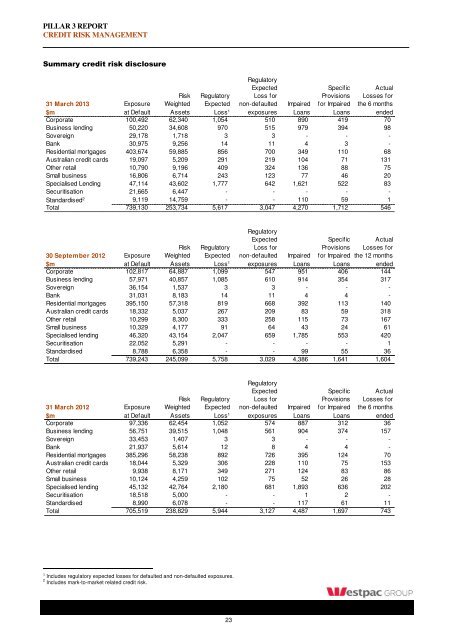
Summary credit risk disclosure 1<br />
Regulatory<br />
Expected Specific Actual<br />
Risk Regulatory Loss for Provisions Losses for<br />
31 <strong>March</strong> <strong>2013</strong> Exposure Weighted Expected non-defaulted Impaired for Impaired the 6 months<br />
$m at Default Assets Loss 1 exposures Loans Loans ended<br />
Corporate 100,492 62,340 1,054 510 890 419 70<br />
Business lending 50,220 34,608 970 515 979 394 98<br />
Sovereign 29,178 1,718 3 3 - - -<br />
Bank 30,975 9,256 14 11 4 3 -<br />
Residential mortgages 403,674 59,885 856 700 349 110 68<br />
Australian credit cards 19,097 5,209 291 219 104 71 131<br />
Other retail 10,790 9,196 409 324 136 88 75<br />
Small business 16,806 6,714 243 123 77 46 20<br />
Specialised Lending 47,114 43,602 1,777 642 1,621 522 83<br />
Securitisation 21,665 6,447 - - - - -<br />
Standardised 2 9,119 14,759 - - 110 59 1<br />
Total 739,130 253,734 5,617 3,047 4,270 1,712 546<br />
Regulatory<br />
Expected Specific Actual<br />
Risk Regulatory Loss for Provisions Losses for<br />
30 September 2012 Exposure Weighted Expected non-defaulted Impaired for Impaired the 12 months<br />
$m at Default Assets Loss 1 exposures Loans Loans ended<br />
Corporate 102,817 64,887 1,099 547 951 406 144<br />
Business lending 57,971 40,857 1,085 610 914 354 317<br />
Sovereign 36,154 1,537 3 3 - - -<br />
Bank 31,031 8,183 14 11 4 4 -<br />
Residential mortgages 395,150 57,318 819 668 392 113 140<br />
Australian credit cards 18,332 5,037 267 209 83 59 318<br />
Other retail 10,299 8,300 333 258 115 73 167<br />
Small business 10,329 4,177 91 64 43 24 61<br />
Specialised lending 46,320 43,154 2,047 659 1,785 553 420<br />
Securitisation 22,052 5,291 - - - - 1<br />
Standardised 8,788 6,358 - - 99 55 36<br />
Total 739,243 245,099 5,758 3,029 4,386 1,641 1,604<br />
Regulatory<br />
Expected Specific Actual<br />
Risk Regulatory Loss for Provisions Losses for<br />
31 <strong>March</strong> 2012 Exposure Weighted Expected non-defaulted Impaired for Impaired the 6 months<br />
$m at Default Assets Loss 1 exposures Loans Loans ended<br />
Corporate 97,336 62,454 1,052 574 887 312 36<br />
Business lending 56,751 39,515 1,048 561 904 374 157<br />
Sovereign 33,453 1,407 3 3 - - -<br />
Bank 21,937 5,614 12 8 4 4 -<br />
Residential mortgages 385,296 58,238 892 726 395 124 70<br />
Australian credit cards 18,044 5,329 306 228 110 75 153<br />
Other retail 9,938 8,171 349 271 124 83 86<br />
Small business 10,124 4,259 102 75 52 26 28<br />
Specialised lending 45,132 42,764 2,180 681 1,893 636 202<br />
Securitisation 18,518 5,000 - - 1 2 -<br />
Standardised 8,990 6,078 - - 117 61 11<br />
Total 705,519 238,829 5,944 3,127 4,487 1,697 743<br />
1 Includes regulatory expected losses for defaulted and non-defaulted exposures.<br />
2 Includes mark-to-market related credit risk.<br />
23


