

Westpac Group Pillar 3 Report March 2013 - Iguana IR Sites
Westpac Group Pillar 3 Report March 2013 - Iguana IR Sites
Westpac Group Pillar 3 Report March 2013 - Iguana IR Sites

You also want an ePaper? Increase the reach of your titles
YUMPU automatically turns print PDFs into web optimized ePapers that Google loves.
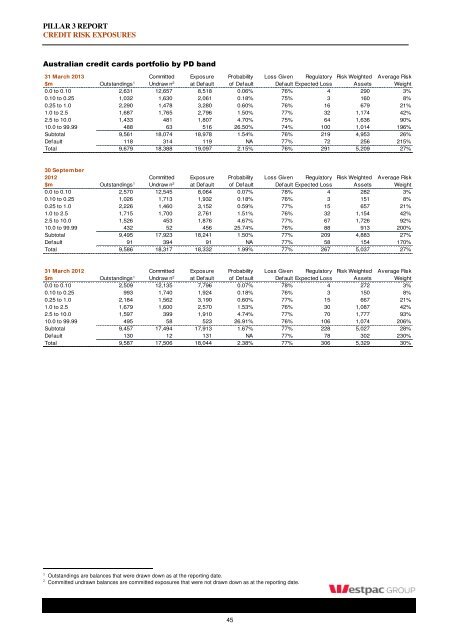
PILLAR 3 REPORT<br />
CREDIT RISK EXPOSURES<br />
Australian credit cards portfolio by PD band<br />
31 <strong>March</strong> <strong>2013</strong> Committed Exposure Probability Loss Given Regulatory Risk Weighted Average Risk<br />
$m Outstandings 1 Undraw n 2 at Default of Default Default Expected Loss Assets Weight<br />
0.0 to 0.10 2,631 12,657 8,518 0.06% 76% 4 290 3%<br />
0.10 to 0.25 1,032 1,630 2,061 0.18% 75% 3 160 8%<br />
0.25 to 1.0 2,290 1,478 3,280 0.60% 76% 16 679 21%<br />
1.0 to 2.5 1,687 1,765 2,796 1.50% 77% 32 1,174 42%<br />
2.5 to 10.0 1,433 481 1,807 4.70% 75% 64 1,636 90%<br />
10.0 to 99.99 488 63 516 26.50% 74% 100 1,014 196%<br />
Subtotal 9,561 18,074 18,978 1.54% 76% 219 4,953 26%<br />
Default 118 314 119 NA 77% 72 256 215%<br />
Total 9,679 18,388 19,097 2.15% 76% 291 5,209 27%<br />
30 September<br />
2012 Committed Exposure Probability Loss Given Regulatory Risk Weighted Average Risk<br />
$m Outstandings 1 Undraw n 2 at Default of Default Default Expected Loss Assets Weight<br />
0.0 to 0.10 2,570 12,545 8,064 0.07% 78% 4 282 3%<br />
0.10 to 0.25 1,026 1,713 1,932 0.18% 76% 3 151 8%<br />
0.25 to 1.0 2,226 1,460 3,152 0.59% 77% 15 657 21%<br />
1.0 to 2.5 1,715 1,700 2,761 1.51% 76% 32 1,154 42%<br />
2.5 to 10.0 1,526 453 1,876 4.67% 77% 67 1,726 92%<br />
10.0 to 99.99 432 52 456 25.74% 76% 88 913 200%<br />
Subtotal 9,495 17,923 18,241 1.50% 77% 209 4,883 27%<br />
Default 91 394 91 NA 77% 58 154 170%<br />
Total 9,586 18,317 18,332 1.99% 77% 267 5,037 27%<br />
31 <strong>March</strong> 2012 Committed Exposure Probability Loss Given Regulatory Risk Weighted Average Risk<br />
$m Outstandings 1 Undraw n 2 at Default of Default Default Expected Loss Assets Weight<br />
0.0 to 0.10 2,509 12,135 7,796 0.07% 78% 4 272 3%<br />
0.10 to 0.25 993 1,740 1,924 0.18% 76% 3 150 8%<br />
0.25 to 1.0 2,184 1,562 3,190 0.60% 77% 15 667 21%<br />
1.0 to 2.5 1,679 1,600 2,570 1.53% 76% 30 1,087 42%<br />
2.5 to 10.0 1,597 399 1,910 4.74% 77% 70 1,777 93%<br />
10.0 to 99.99 495 58 523 26.91% 76% 106 1,074 206%<br />
Subtotal 9,457 17,494 17,913 1.67% 77% 228 5,027 28%<br />
Default 130 12 131 NA 77% 78 302 230%<br />
Total 9,587 17,506 18,044 2.38% 77% 306 5,329 30%<br />
1 Outstandings are balances that were drawn down as at the reporting date.<br />
2 Committed undrawn balances are committed exposures that were not drawn down as at the reporting date.<br />
45


