

Westpac Group Pillar 3 Report March 2013 - Iguana IR Sites
Westpac Group Pillar 3 Report March 2013 - Iguana IR Sites
Westpac Group Pillar 3 Report March 2013 - Iguana IR Sites

Create successful ePaper yourself
Turn your PDF publications into a flip-book with our unique Google optimized e-Paper software.
PILLAR 3 REPORT<br />
CREDIT RISK EXPOSURES<br />
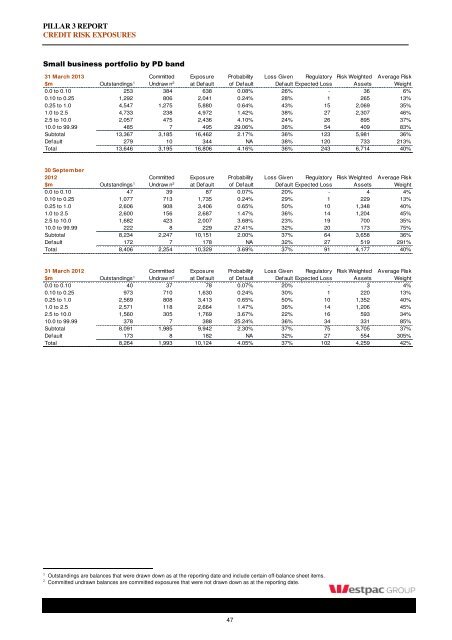
Small business portfolio by PD band 12<br />
31 <strong>March</strong> <strong>2013</strong> Committed Exposure Probability Loss Given Regulatory Risk Weighted Average Risk<br />
$m Outstandings 1 Undraw n 2 at Default of Default Default Expected Loss Assets Weight<br />
0.0 to 0.10 253 384 638 0.08% 26% - 36 6%<br />
0.10 to 0.25 1,292 806 2,041 0.24% 28% 1 265 13%<br />
0.25 to 1.0 4,547 1,275 5,880 0.64% 43% 15 2,069 35%<br />
1.0 to 2.5 4,733 238 4,972 1.42% 38% 27 2,307 46%<br />
2.5 to 10.0 2,057 475 2,436 4.10% 24% 26 895 37%<br />
10.0 to 99.99 485 7 495 29.06% 36% 54 409 83%<br />
Subtotal 13,367 3,185 16,462 2.17% 36% 123 5,981 36%<br />
Default 279 10 344 NA 38% 120 733 213%<br />
Total 13,646 3,195 16,806 4.16% 36% 243 6,714 40%<br />
30 September<br />
2012 Committed Exposure Probability Loss Given Regulatory Risk Weighted Average Risk<br />
$m Outstandings 1 Undraw n 2 at Default of Default Default Expected Loss Assets Weight<br />
0.0 to 0.10 47 39 87 0.07% 20% - 4 4%<br />
0.10 to 0.25 1,077 713 1,735 0.24% 29% 1 229 13%<br />
0.25 to 1.0 2,606 908 3,406 0.65% 50% 10 1,348 40%<br />
1.0 to 2.5 2,600 156 2,687 1.47% 36% 14 1,204 45%<br />
2.5 to 10.0 1,682 423 2,007 3.68% 23% 19 700 35%<br />
10.0 to 99.99 222 8 229 27.41% 32% 20 173 75%<br />
Subtotal 8,234 2,247 10,151 2.00% 37% 64 3,658 36%<br />
Default 172 7 178 NA 32% 27 519 291%<br />
Total 8,406 2,254 10,329 3.69% 37% 91 4,177 40%<br />
31 <strong>March</strong> 2012 Committed Exposure Probability Loss Given Regulatory Risk Weighted Average Risk<br />
$m Outstandings 1 Undraw n 2 at Default of Default Default Expected Loss Assets Weight<br />
0.0 to 0.10 40 37 78 0.07% 20% - 3 4%<br />
0.10 to 0.25 973 710 1,630 0.24% 30% 1 220 13%<br />
0.25 to 1.0 2,569 808 3,413 0.65% 50% 10 1,352 40%<br />
1.0 to 2.5 2,571 118 2,664 1.47% 36% 14 1,206 45%<br />
2.5 to 10.0 1,560 305 1,769 3.67% 22% 16 593 34%<br />
10.0 to 99.99 378 7 388 25.24% 36% 34 331 85%<br />
Subtotal 8,091 1,985 9,942 2.30% 37% 75 3,705 37%<br />
Default 173 8 182 NA 32% 27 554 305%<br />
Total 8,264 1,993 10,124 4.05% 37% 102 4,259 42%<br />
1 Outstandings are balances that were drawn down as at the reporting date and include certain off-balance sheet items.<br />
2 Committed undrawn balances are committed exposures that were not drawn down as at the reporting date.<br />
47


