

Westpac Group Pillar 3 Report March 2013 - Iguana IR Sites
Westpac Group Pillar 3 Report March 2013 - Iguana IR Sites
Westpac Group Pillar 3 Report March 2013 - Iguana IR Sites

Create successful ePaper yourself
Turn your PDF publications into a flip-book with our unique Google optimized e-Paper software.
PILLAR 3 REPORT<br />
CREDIT RISK EXPOSURES<br />
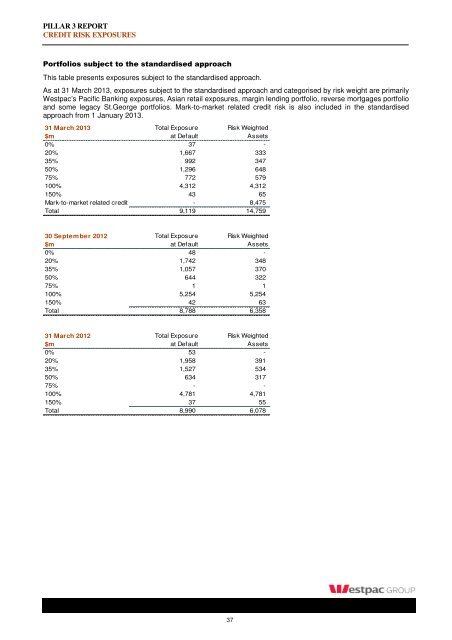
Portfolios subject to the standardised approach<br />
This table presents exposures subject to the standardised approach.<br />
As at 31 <strong>March</strong> <strong>2013</strong>, exposures subject to the standardised approach and categorised by risk weight are primarily<br />
<strong>Westpac</strong>’s Pacific Banking exposures, Asian retail exposures, margin lending portfolio, reverse mortgages portfolio<br />
and some legacy St.George portfolios. Mark-to-market related credit risk is also included in the standardised<br />
approach from 1 January <strong>2013</strong>.<br />
31 <strong>March</strong> <strong>2013</strong> Total Exposure Risk Weighted<br />
$m at Default Assets<br />
0% 37 -<br />
20% 1,667 333<br />
35% 992 347<br />
50% 1,296 648<br />
75% 772 579<br />
100% 4,312 4,312<br />
150% 43 65<br />
Mark-to-market related credit risk - 8,475<br />
Total 9,119 14,759<br />
30 September 2012 Total Exposure Risk Weighted<br />
$m at Default Assets<br />
0% 48 -<br />
20% 1,742 348<br />
35% 1,057 370<br />
50% 644 322<br />
75% 1 1<br />
100% 5,254 5,254<br />
150% 42 63<br />
Total 8,788 6,358<br />
31 <strong>March</strong> 2012 Total Exposure Risk Weighted<br />
$m at Default Assets<br />
0% 53 -<br />
20% 1,958 391<br />
35% 1,527 534<br />
50% 634 317<br />
75% - -<br />
100% 4,781 4,781<br />
150% 37 55<br />
Total 8,990 6,078<br />
37


