Electrons and Quantum Mechanics - Oakland Schools
Electrons and Quantum Mechanics - Oakland Schools
Electrons and Quantum Mechanics - Oakland Schools

You also want an ePaper? Increase the reach of your titles
YUMPU automatically turns print PDFs into web optimized ePapers that Google loves.
4. Return the front target, carbon paper, marble, <strong>and</strong> paper clips to locations<br />
designated by your teacher.<br />
Data Analysis <strong>and</strong> Concept Development<br />
1. Locate the 95 dots (95% of the 100) that are closest to the bulls-eye. Using a pencil,<br />
draw a smooth (not wavy) curve to enclose the region containing these dots. This<br />
region represents the two-dimensional orbital of your marble electron (analogous to the<br />
region of space where an electron might be observed 95% of the time in an experiment<br />
to locate it in three-dimensional space).<br />
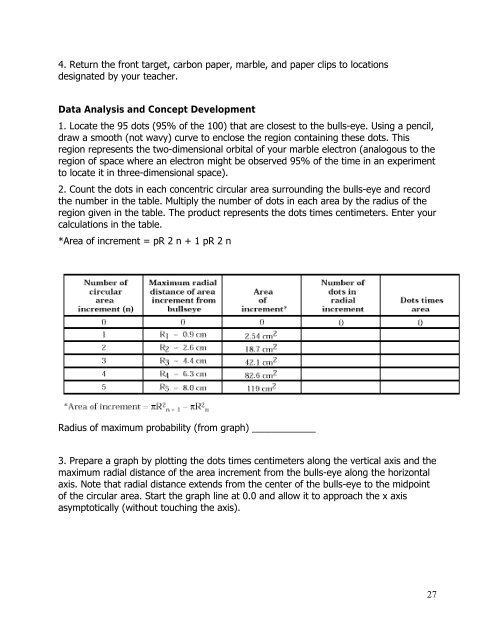
2. Count the dots in each concentric circular area surrounding the bulls-eye <strong>and</strong> record<br />
the number in the table. Multiply the number of dots in each area by the radius of the<br />
region given in the table. The product represents the dots times centimeters. Enter your<br />
calculations in the table.<br />
*Area of increment = pR 2 n + 1 pR 2 n<br />
Radius of maximum probability (from graph) ____________<br />
3. Prepare a graph by plotting the dots times centimeters along the vertical axis <strong>and</strong> the<br />
maximum radial distance of the area increment from the bulls-eye along the horizontal<br />
axis. Note that radial distance extends from the center of the bulls-eye to the midpoint<br />
of the circular area. Start the graph line at 0.0 <strong>and</strong> allow it to approach the x axis<br />
asymptotically (without touching the axis).<br />
27