Electrons and Quantum Mechanics - Oakland Schools
Electrons and Quantum Mechanics - Oakland Schools
Electrons and Quantum Mechanics - Oakland Schools

You also want an ePaper? Increase the reach of your titles
YUMPU automatically turns print PDFs into web optimized ePapers that Google loves.
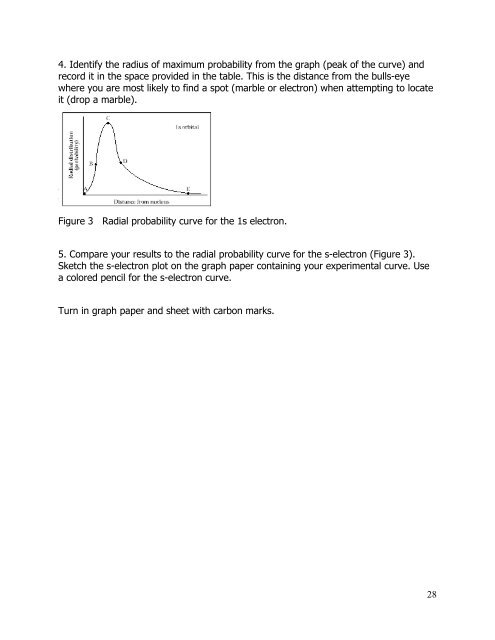
4. Identify the radius of maximum probability from the graph (peak of the curve) <strong>and</strong><br />
record it in the space provided in the table. This is the distance from the bulls-eye<br />
where you are most likely to find a spot (marble or electron) when attempting to locate<br />
it (drop a marble).<br />
Figure 3 Radial probability curve for the 1s electron.<br />
5. Compare your results to the radial probability curve for the s-electron (Figure 3).<br />
Sketch the s-electron plot on the graph paper containing your experimental curve. Use<br />
a colored pencil for the s-electron curve.<br />
Turn in graph paper <strong>and</strong> sheet with carbon marks.<br />
28