Electrons and Quantum Mechanics - Oakland Schools
Electrons and Quantum Mechanics - Oakland Schools
Electrons and Quantum Mechanics - Oakland Schools

You also want an ePaper? Increase the reach of your titles
YUMPU automatically turns print PDFs into web optimized ePapers that Google loves.
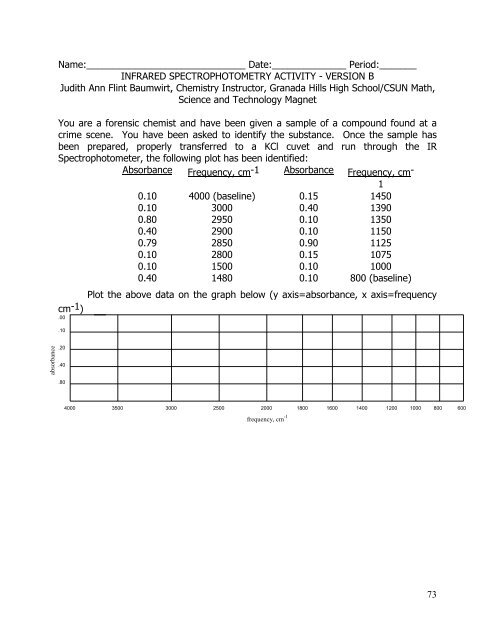
Name:______________________________ Date:______________ Period:_______<br />
INFRARED SPECTROPHOTOMETRY ACTIVITY - VERSION B<br />
Judith Ann Flint Baumwirt, Chemistry Instructor, Granada Hills High School/CSUN Math,<br />
Science <strong>and</strong> Technology Magnet<br />
You are a forensic chemist <strong>and</strong> have been given a sample of a compound found at a<br />
crime scene. You have been asked to identify the substance. Once the sample has<br />
been prepared, properly transferred to a KCl cuvet <strong>and</strong> run through the IR<br />
Spectrophotometer, the following plot has been identified:<br />
Absorbance Frequency, cm-1 Absorbance Frequency, cm -<br />
1<br />
0.10 4000 (baseline) 0.15 1450<br />
0.10 3000 0.40 1390<br />
0.80 2950 0.10 1350<br />
0.40 2900 0.10 1150<br />
0.79 2850 0.90 1125<br />
0.10 2800 0.15 1075<br />
0.10 1500 0.10 1000<br />
0.40 1480 0.10 800 (baseline)<br />
Plot the above data on the graph below (y axis=absorbance, x axis=frequency<br />
cm -1 )<br />
600<br />
.00<br />
.10<br />
absorbance<br />
.20<br />
.40<br />
.80<br />
4000<br />
3500<br />
3000<br />
2500<br />
2000<br />
1800<br />
1600<br />
1400<br />
1200<br />
1000<br />
800<br />
frequency, cm -1 73