Pedestrian safety - Global Road Safety Partnership
Pedestrian safety - Global Road Safety Partnership
Pedestrian safety - Global Road Safety Partnership

You also want an ePaper? Increase the reach of your titles
YUMPU automatically turns print PDFs into web optimized ePapers that Google loves.
Evaluating pedestrian <strong>safety</strong> programmes<br />
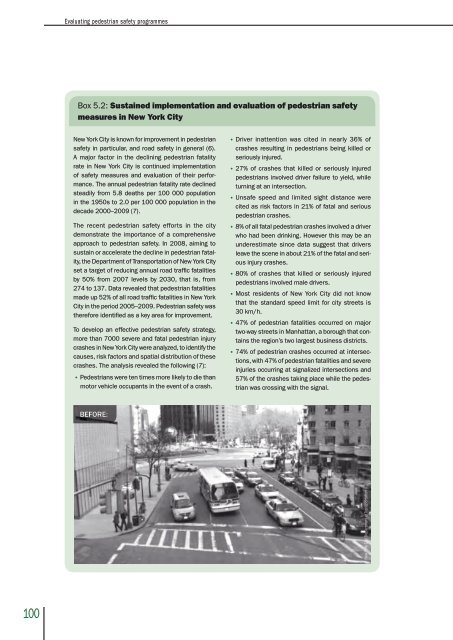
Box 5.2: Sustained implementation and evaluation of pedestrian <strong>safety</strong><br />
measures in New York City<br />
New York City is known for improvement in pedestrian<br />
<strong>safety</strong> in particular, and road <strong>safety</strong> in general (6).<br />
A major factor in the declining pedestrian fatality<br />
rate in New York City is continued implementation<br />
of <strong>safety</strong> measures and evaluation of their performance.<br />
The annual pedestrian fatality rate declined<br />
steadily from 5.8 deaths per 100 000 population<br />
in the 1950s to 2.0 per 100 000 population in the<br />
decade 2000–2009 (7).<br />
The recent pedestrian <strong>safety</strong> efforts in the city<br />
demonstrate the importance of a comprehensive<br />
approach to pedestrian <strong>safety</strong>. In 2008, aiming to<br />
sustain or accelerate the decline in pedestrian fatality,<br />
the Department of Transportation of New York City<br />
set a target of reducing annual road traffic fatalities<br />
by 50% from 2007 levels by 2030, that is, from<br />
274 to 137. Data revealed that pedestrian fatalities<br />
made up 52% of all road traffic fatalities in New York<br />
City in the period 2005–2009. <strong>Pedestrian</strong> <strong>safety</strong> was<br />
therefore identified as a key area for improvement.<br />
To develop an effective pedestrian <strong>safety</strong> strategy,<br />
more than 7000 severe and fatal pedestrian injury<br />
crashes in New York City were analyzed, to identify the<br />
causes, risk factors and spatial distribution of these<br />
crashes. The analysis revealed the following (7):<br />
• <strong>Pedestrian</strong>s were ten times more likely to die than<br />
motor vehicle occupants in the event of a crash.<br />
• Driver inattention was cited in nearly 36% of<br />
crashes resulting in pedestrians being killed or<br />
seriously injured.<br />
• 27% of crashes that killed or seriously injured<br />
pedestrians involved driver failure to yield, while<br />
turning at an intersection.<br />
• Unsafe speed and limited sight distance were<br />
cited as risk factors in 21% of fatal and serious<br />
pedestrian crashes.<br />
• 8% of all fatal pedestrian crashes involved a driver<br />
who had been drinking. However this may be an<br />
underestimate since data suggest that drivers<br />
leave the scene in about 21% of the fatal and serious<br />
injury crashes.<br />
• 80% of crashes that killed or seriously injured<br />
pedestrians involved male drivers.<br />
• Most residents of New York City did not know<br />
that the standard speed limit for city streets is<br />
30 km/h.<br />
• 47% of pedestrian fatalities occurred on major<br />
two-way streets in Manhattan, a borough that contains<br />
the region’s two largest business districts.<br />
• 74% of pedestrian crashes occurred at intersections,<br />
with 47% of pedestrian fatalities and severe<br />
injuries occurring at signalized intersections and<br />
57% of the crashes taking place while the pedestrian<br />
was crossing with the signal.<br />
BEFORE:<br />
New York City Department of Transportation<br />
100