The economic effects of EU-reforms in corporate income tax systems
The economic effects of EU-reforms in corporate income tax systems
The economic effects of EU-reforms in corporate income tax systems

Create successful ePaper yourself
Turn your PDF publications into a flip-book with our unique Google optimized e-Paper software.
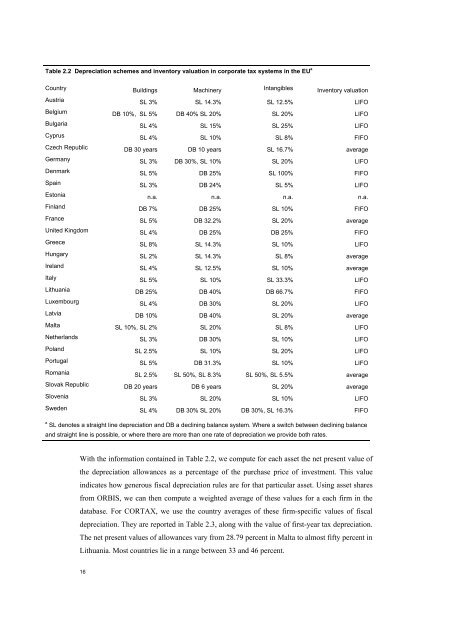
Table 2.2 Depreciation schemes and <strong>in</strong>ventory valuation <strong>in</strong> <strong>corporate</strong> <strong>tax</strong> <strong>systems</strong> <strong>in</strong> the <strong>EU</strong> a<br />
Country Build<strong>in</strong>gs Mach<strong>in</strong>ery Intangibles Inventory valuation<br />
Austria SL 3% SL 14.3% SL 12.5% LIFO<br />
Belgium DB 10%, SL 5% DB 40% SL 20% SL 20% LIFO<br />
Bulgaria SL 4% SL 15% SL 25% LIFO<br />
Cyprus SL 4% SL 10% SL 8% FIFO<br />
Czech Republic DB 30 years DB 10 years SL 16.7% average<br />
Germany SL 3% DB 30%, SL 10% SL 20% LIFO<br />
Denmark SL 5% DB 25% SL 100% FIFO<br />
Spa<strong>in</strong> SL 3% DB 24% SL 5% LIFO<br />
Estonia n.a. n.a. n.a. n.a.<br />
F<strong>in</strong>land DB 7% DB 25% SL 10% FIFO<br />
France SL 5% DB 32.2% SL 20% average<br />
United K<strong>in</strong>gdom SL 4% DB 25% DB 25% FIFO<br />
Greece SL 8% SL 14.3% SL 10% LIFO<br />
Hungary SL 2% SL 14.3% SL 8% average<br />
Ireland SL 4% SL 12.5% SL 10% average<br />
Italy SL 5% SL 10% SL 33.3% LIFO<br />
Lithuania DB 25% DB 40% DB 66.7% FIFO<br />
Luxembourg SL 4% DB 30% SL 20% LIFO<br />
Latvia DB 10% DB 40% SL 20% average<br />
Malta SL 10%, SL 2% SL 20% SL 8% LIFO<br />
Netherlands SL 3% DB 30% SL 10% LIFO<br />
Poland SL 2.5% SL 10% SL 20% LIFO<br />
Portugal SL 5% DB 31.3% SL 10% LIFO<br />
Romania SL 2.5% SL 50%, SL 8.3% SL 50%, SL 5.5% average<br />
Slovak Republic DB 20 years DB 6 years SL 20% average<br />
Slovenia SL 3% SL 20% SL 10% LIFO<br />
Sweden SL 4% DB 30% SL 20% DB 30%, SL 16.3% FIFO<br />
a<br />
SL denotes a straight l<strong>in</strong>e depreciation and DB a decl<strong>in</strong><strong>in</strong>g balance system. Where a switch between decl<strong>in</strong><strong>in</strong>g balance<br />
and straight l<strong>in</strong>e is possible, or where there are more than one rate <strong>of</strong> depreciation we provide both rates.<br />
With the <strong>in</strong>formation conta<strong>in</strong>ed <strong>in</strong> Table 2.2, we compute for each asset the net present value <strong>of</strong><br />
the depreciation allowances as a percentage <strong>of</strong> the purchase price <strong>of</strong> <strong>in</strong>vestment. This value<br />
<strong>in</strong>dicates how generous fiscal depreciation rules are for that particular asset. Us<strong>in</strong>g asset shares<br />
from ORBIS, we can then compute a weighted average <strong>of</strong> these values for a each firm <strong>in</strong> the<br />
database. For CORTAX, we use the country averages <strong>of</strong> these firm-specific values <strong>of</strong> fiscal<br />
depreciation. <strong>The</strong>y are reported <strong>in</strong> Table 2.3, along with the value <strong>of</strong> first-year <strong>tax</strong> depreciation.<br />
<strong>The</strong> net present values <strong>of</strong> allowances vary from 28.79 percent <strong>in</strong> Malta to almost fifty percent <strong>in</strong><br />
Lithuania. Most countries lie <strong>in</strong> a range between 33 and 46 percent.<br />
16