The economic effects of EU-reforms in corporate income tax systems
The economic effects of EU-reforms in corporate income tax systems
The economic effects of EU-reforms in corporate income tax systems

Create successful ePaper yourself
Turn your PDF publications into a flip-book with our unique Google optimized e-Paper software.
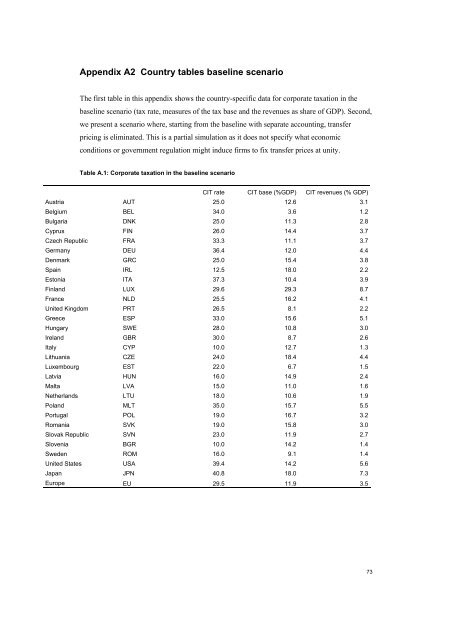
Appendix A2 Country tables basel<strong>in</strong>e scenario<br />
<strong>The</strong> first table <strong>in</strong> this appendix shows the country-specific data for <strong>corporate</strong> <strong>tax</strong>ation <strong>in</strong> the<br />
basel<strong>in</strong>e scenario (<strong>tax</strong> rate, measures <strong>of</strong> the <strong>tax</strong> base and the revenues as share <strong>of</strong> GDP). Second,<br />
we present a scenario where, start<strong>in</strong>g from the basel<strong>in</strong>e with separate account<strong>in</strong>g, transfer<br />
pric<strong>in</strong>g is elim<strong>in</strong>ated. This is a partial simulation as it does not specify what <strong>economic</strong><br />
conditions or government regulation might <strong>in</strong>duce firms to fix transfer prices at unity.<br />
Table A.1: Corporate <strong>tax</strong>ation <strong>in</strong> the basel<strong>in</strong>e scenario<br />
CIT rate CIT base (%GDP) CIT revenues (% GDP)<br />
Austria AUT 25.0 12.6 3.1<br />
Belgium BEL 34.0 3.6 1.2<br />
Bulgaria DNK 25.0 11.3 2.8<br />
Cyprus FIN 26.0 14.4 3.7<br />
Czech Republic FRA 33.3 11.1 3.7<br />
Germany D<strong>EU</strong> 36.4 12.0 4.4<br />
Denmark GRC 25.0 15.4 3.8<br />
Spa<strong>in</strong> IRL 12.5 18.0 2.2<br />
Estonia ITA 37.3 10.4 3.9<br />
F<strong>in</strong>land LUX 29.6 29.3 8.7<br />
France NLD 25.5 16.2 4.1<br />
United K<strong>in</strong>gdom PRT 26.5 8.1 2.2<br />
Greece ESP 33.0 15.6 5.1<br />
Hungary SWE 28.0 10.8 3.0<br />
Ireland GBR 30.0 8.7 2.6<br />
Italy CYP 10.0 12.7 1.3<br />
Lithuania CZE 24.0 18.4 4.4<br />
Luxembourg EST 22.0 6.7 1.5<br />
Latvia HUN 16.0 14.9 2.4<br />
Malta LVA 15.0 11.0 1.6<br />
Netherlands LTU 18.0 10.6 1.9<br />
Poland MLT 35.0 15.7 5.5<br />
Portugal POL 19.0 16.7 3.2<br />
Romania SVK 19.0 15.8 3.0<br />
Slovak Republic SVN 23.0 11.9 2.7<br />
Slovenia BGR 10.0 14.2 1.4<br />
Sweden ROM 16.0 9.1 1.4<br />
United States USA 39.4 14.2 5.6<br />
Japan JPN 40.8 18.0 7.3<br />
Europe <strong>EU</strong> 29.5 11.9 3.5<br />
73