The economic effects of EU-reforms in corporate income tax systems
The economic effects of EU-reforms in corporate income tax systems
The economic effects of EU-reforms in corporate income tax systems
You also want an ePaper? Increase the reach of your titles
YUMPU automatically turns print PDFs into web optimized ePapers that Google loves.
other hand, loss consolidation causes a narrow<strong>in</strong>g <strong>of</strong> <strong>tax</strong> bases. Despite the higher rates<br />
necessary to cover the revenue loss <strong>of</strong> consolidation, we f<strong>in</strong>d that the cost <strong>of</strong> capital does not<br />
change significantly. <strong>The</strong> reduction <strong>in</strong> labour costs <strong>in</strong>duced by loss consolidation <strong>in</strong>creases<br />
employment, however, by 0.2%. This also stimulates <strong>in</strong>vestment as more employment raises the<br />
return to capital. Investment expands by 0.3%. GDP rises by 0.2% and welfare by 0.1% <strong>of</strong><br />
GDP.<br />
Compared to the CCTB Table 3.2, the <strong>economic</strong> <strong>effects</strong> <strong>of</strong> the CCCTB are more favourable.<br />
<strong>The</strong>refore, we may conclude that consolidation and formula apportionment by itself exerts a<br />
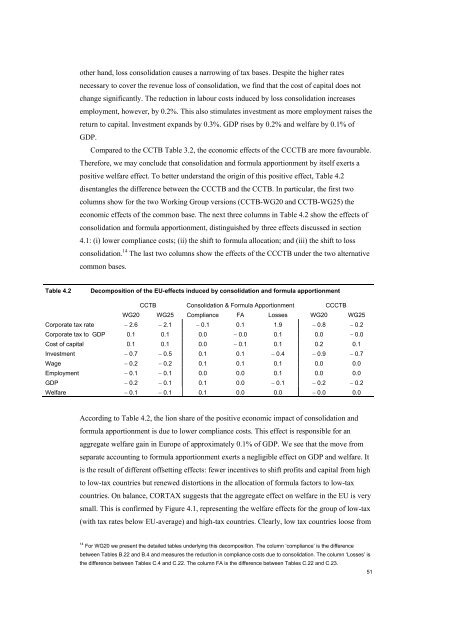
positive welfare effect. To better understand the orig<strong>in</strong> <strong>of</strong> this positive effect, Table 4.2<br />
disentangles the difference between the CCCTB and the CCTB. In particular, the first two<br />
columns show for the two Work<strong>in</strong>g Group versions (CCTB-WG20 and CCTB-WG25) the<br />
<strong>economic</strong> <strong>effects</strong> <strong>of</strong> the common base. <strong>The</strong> next three columns <strong>in</strong> Table 4.2 show the <strong>effects</strong> <strong>of</strong><br />
consolidation and formula apportionment, dist<strong>in</strong>guished by three <strong>effects</strong> discussed <strong>in</strong> section<br />
4.1: (i) lower compliance costs; (ii) the shift to formula allocation; and (iii) the shift to loss<br />
consolidation. 14 <strong>The</strong> last two columns show the <strong>effects</strong> <strong>of</strong> the CCCTB under the two alternative<br />
common bases.<br />
Table 4.2<br />
Decomposition <strong>of</strong> the <strong>EU</strong>-<strong>effects</strong> <strong>in</strong>duced by consolidation and formula apportionment<br />
CCTB Consolidation & Formula Apportionment CCCTB<br />
WG20 WG25 Compliance FA Losses WG20 WG25<br />
Corporate <strong>tax</strong> rate − 2.6 − 2.1 − 0.1 0.1 1.9 − 0.8 − 0.2<br />
Corporate <strong>tax</strong> to GDP 0.1 0.1 0.0 − 0.0 0.1 0.0 − 0.0<br />
Cost <strong>of</strong> capital 0.1 0.1 0.0 − 0.1 0.1 0.2 0.1<br />
Investment − 0.7 − 0.5 0.1 0.1 − 0.4 − 0.9 − 0.7<br />
Wage − 0.2 − 0.2 0.1 0.1 0.1 0.0 0.0<br />
Employment − 0.1 − 0.1 0.0 0.0 0.1 0.0 0.0<br />
GDP − 0.2 − 0.1 0.1 0.0 − 0.1 − 0.2 − 0.2<br />
Welfare − 0.1 − 0.1 0.1 0.0 0.0 − 0.0 0.0<br />
Accord<strong>in</strong>g to Table 4.2, the lion share <strong>of</strong> the positive <strong>economic</strong> impact <strong>of</strong> consolidation and<br />
formula apportionment is due to lower compliance costs. This effect is responsible for an<br />
aggregate welfare ga<strong>in</strong> <strong>in</strong> Europe <strong>of</strong> approximately 0.1% <strong>of</strong> GDP. We see that the move from<br />
separate account<strong>in</strong>g to formula apportionment exerts a negligible effect on GDP and welfare. It<br />
is the result <strong>of</strong> different <strong>of</strong>fsett<strong>in</strong>g <strong>effects</strong>: fewer <strong>in</strong>centives to shift pr<strong>of</strong>its and capital from high<br />
to low-<strong>tax</strong> countries but renewed distortions <strong>in</strong> the allocation <strong>of</strong> formula factors to low-<strong>tax</strong><br />
countries. On balance, CORTAX suggests that the aggregate effect on welfare <strong>in</strong> the <strong>EU</strong> is very<br />
small. This is confirmed by Figure 4.1, represent<strong>in</strong>g the welfare <strong>effects</strong> for the group <strong>of</strong> low-<strong>tax</strong><br />
(with <strong>tax</strong> rates below <strong>EU</strong>-average) and high-<strong>tax</strong> countries. Clearly, low <strong>tax</strong> countries loose from<br />
14 For WG20 we present the detailed tables underly<strong>in</strong>g this decomposition. <strong>The</strong> column ‘compliance’ is the difference<br />
between Tables B.22 and B.4 and measures the reduction <strong>in</strong> compliance costs due to consolidation. <strong>The</strong> column ‘Losses’ is<br />
the difference between Tables C.4 and C.22. <strong>The</strong> column FA is the difference between Tables C.22 and C.23.<br />
51


