The economic effects of EU-reforms in corporate income tax systems
The economic effects of EU-reforms in corporate income tax systems
The economic effects of EU-reforms in corporate income tax systems

Create successful ePaper yourself
Turn your PDF publications into a flip-book with our unique Google optimized e-Paper software.
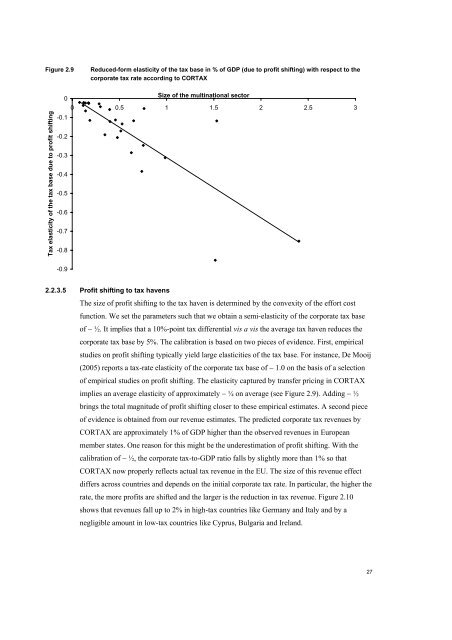
Figure 2.9<br />
Reduced-form elasticity <strong>of</strong> the <strong>tax</strong> base <strong>in</strong> % <strong>of</strong> GDP (due to pr<strong>of</strong>it shift<strong>in</strong>g) with respect to the<br />
<strong>corporate</strong> <strong>tax</strong> rate accord<strong>in</strong>g to CORTAX<br />
Tax elasticity <strong>of</strong> the <strong>tax</strong> base due to pr<strong>of</strong>it shift<strong>in</strong>g<br />
Size <strong>of</strong> the mult<strong>in</strong>ational sector<br />
0<br />
0 0.5 1 1.5 2 2.5 3<br />
-0.1<br />
-0.2<br />
-0.3<br />
-0.4<br />
-0.5<br />
-0.6<br />
-0.7<br />
-0.8<br />
-0.9<br />
2.2.3.5 Pr<strong>of</strong>it shift<strong>in</strong>g to <strong>tax</strong> havens<br />
<strong>The</strong> size <strong>of</strong> pr<strong>of</strong>it shift<strong>in</strong>g to the <strong>tax</strong> haven is determ<strong>in</strong>ed by the convexity <strong>of</strong> the effort cost<br />
function. We set the parameters such that we obta<strong>in</strong> a semi-elasticity <strong>of</strong> the <strong>corporate</strong> <strong>tax</strong> base<br />
<strong>of</strong> − ½. It implies that a 10%-po<strong>in</strong>t <strong>tax</strong> differential vis a vis the average <strong>tax</strong> haven reduces the<br />
<strong>corporate</strong> <strong>tax</strong> base by 5%. <strong>The</strong> calibration is based on two pieces <strong>of</strong> evidence. First, empirical<br />
studies on pr<strong>of</strong>it shift<strong>in</strong>g typically yield large elasticities <strong>of</strong> the <strong>tax</strong> base. For <strong>in</strong>stance, De Mooij<br />
(2005) reports a <strong>tax</strong>-rate elasticity <strong>of</strong> the <strong>corporate</strong> <strong>tax</strong> base <strong>of</strong> − 1.0 on the basis <strong>of</strong> a selection<br />
<strong>of</strong> empirical studies on pr<strong>of</strong>it shift<strong>in</strong>g. <strong>The</strong> elasticity captured by transfer pric<strong>in</strong>g <strong>in</strong> CORTAX<br />
implies an average elasticity <strong>of</strong> approximately − ¼ on average (see Figure 2.9). Add<strong>in</strong>g − ½<br />
br<strong>in</strong>gs the total magnitude <strong>of</strong> pr<strong>of</strong>it shift<strong>in</strong>g closer to these empirical estimates. A second piece<br />
<strong>of</strong> evidence is obta<strong>in</strong>ed from our revenue estimates. <strong>The</strong> predicted <strong>corporate</strong> <strong>tax</strong> revenues by<br />
CORTAX are approximately 1% <strong>of</strong> GDP higher than the observed revenues <strong>in</strong> European<br />
member states. One reason for this might be the underestimation <strong>of</strong> pr<strong>of</strong>it shift<strong>in</strong>g. With the<br />
calibration <strong>of</strong> − ½, the <strong>corporate</strong> <strong>tax</strong>-to-GDP ratio falls by slightly more than 1% so that<br />
CORTAX now properly reflects actual <strong>tax</strong> revenue <strong>in</strong> the <strong>EU</strong>. <strong>The</strong> size <strong>of</strong> this revenue effect<br />
differs across countries and depends on the <strong>in</strong>itial <strong>corporate</strong> <strong>tax</strong> rate. In particular, the higher the<br />
rate, the more pr<strong>of</strong>its are shifted and the larger is the reduction <strong>in</strong> <strong>tax</strong> revenue. Figure 2.10<br />
shows that revenues fall up to 2% <strong>in</strong> high-<strong>tax</strong> countries like Germany and Italy and by a<br />
negligible amount <strong>in</strong> low-<strong>tax</strong> countries like Cyprus, Bulgaria and Ireland.<br />
27