- Page 1 and 2:
NATIONAL INSTITUTE FOR EARLY EDUCAT
- Page 3 and 4:
THE STATE OF PRESCHOOL 2008 STATE P
- Page 5 and 6:
Nebraska ..........................
- Page 7 and 8:
NATIONAL ACCESS Total state program
- Page 9 and 10:
STATE-FUNDED PRESCHOOL EDUCATION: P
- Page 11 and 12:
SHADOWS OF THINGS THAT MAY BE As st
- Page 13 and 14:
QUALITY STANDARDS: MEETING GREAT EX
- Page 15 and 16:
RESOURCES: HARD TIMES AHEAD? During
- Page 17 and 18:
TABLE 2: PRE-K ACCESS BY STATE ACCE
- Page 19 and 20:
TABLE 4: 2007-2008 ENROLLMENT OF 3-
- Page 21 and 22:
TABLE 6: RANKINGS OF PRE-K RESOURCE
- Page 23 and 24:
WHAT QUALIFIES AS A STATE PRESCHOOL
- Page 25 and 26:
The sections below provide an overv
- Page 27 and 28:
Early learning standards are also c
- Page 29 and 30:
ACCESS Total state program enrollme
- Page 32 and 33:
PERCENT OF STATE POPULATION ENROLLE
- Page 34 and 35:
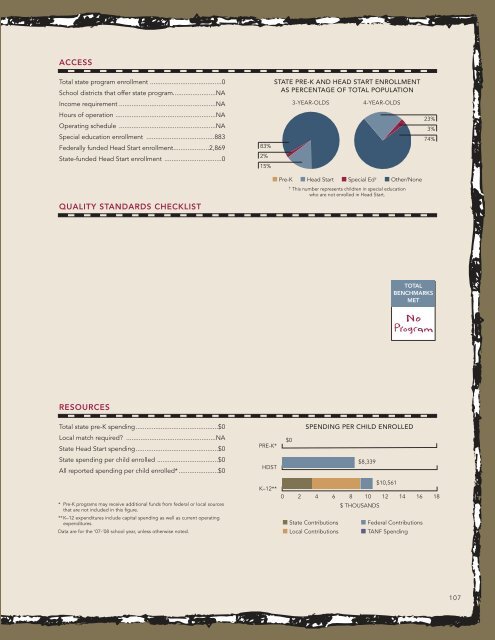
NO PROGRAM laska has provided a sup
- Page 36 and 37:
PERCENT OF STATE POPULATION ENROLLE
- Page 38 and 39:
PERCENT OF STATE POPULATION ENROLLE
- Page 40 and 41:
PERCENT OF STATE POPULATION ENROLLE
- Page 42 and 43:
PERCENT OF STATE POPULATION ENROLLE
- Page 44 and 45:
PERCENT OF STATE POPULATION ENROLLE
- Page 46 and 47:
PERCENT OF STATE POPULATION ENROLLE
- Page 48 and 49:
PERCENT OF STATE POPULATION ENROLLE
- Page 50 and 51:
PERCENT OF STATE POPULATION ENROLLE
- Page 52 and 53:
NO PROGRAM awaii does not have a st
- Page 54 and 55:
NO PROGRAM ACCESS RANKINGS 4-YEAR-O
- Page 56 and 57:
PERCENT OF STATE POPULATION ENROLLE
- Page 58 and 59: NO PROGRAM ACCESS RANKINGS 4-YEAR-O
- Page 60 and 61: PERCENT OF STATE POPULATION ENROLLE
- Page 62 and 63: IOWA SHARED VISIONS ACCESS Total st
- Page 64 and 65: PERCENT OF STATE POPULATION ENROLLE
- Page 66 and 67: PERCENT OF STATE POPULATION ENROLLE
- Page 68 and 69: PERCENT OF STATE POPULATION ENROLLE
- Page 70 and 71: LOUISIANA 8(g) STUDENT ENHANCEMENT
- Page 72: LOUISIANA NONPUBLIC SCHOOLS EARLY C
- Page 75 and 76: MAINE PUBLIC PRESCHOOL PROGRAM ACCE
- Page 77 and 78: MARYLAND PREKINDERGARTEN PROGRAM AC
- Page 79 and 80: MASSACHUSETTS UNIVERSAL PRE-KINDERG
- Page 81 and 82: MICHIGAN SCHOOL READINESS PROGRAM A
- Page 83 and 84: MINNESOTA HEAD START ACCESS Total s
- Page 85 and 86: ACCESS Total state program enrollme
- Page 87 and 88: MISSOURI PRESCHOOL PROJECT ACCESS T
- Page 89 and 90: ACCESS Total state program enrollme
- Page 91 and 92: NEBRASKA EARLY CHILDHOOD EDUCATION
- Page 93 and 94: NEVADA STATE PREKINDERGARTEN EDUCAT
- Page 95 and 96: ACCESS Total state program enrollme
- Page 97 and 98: STATE OVERVIEW Total state program
- Page 99 and 100: NEW JERSEY NON-ABBOTT EARLY CHILDHO
- Page 102 and 103: PERCENT OF STATE POPULATION ENROLLE
- Page 104 and 105: PERCENT OF STATE POPULATION ENROLLE
- Page 106 and 107: PERCENT OF STATE POPULATION ENROLLE
- Page 110 and 111: PERCENT OF STATE POPULATION ENROLLE
- Page 112 and 113: OHIO EARLY CHILDHOOD EDUCATION ACCE
- Page 114 and 115: PERCENT OF STATE POPULATION ENROLLE
- Page 116 and 117: PERCENT OF STATE POPULATION ENROLLE
- Page 118 and 119: PERCENT OF STATE POPULATION ENROLLE
- Page 120 and 121: PENNSYLVANIA EDUCATION ACCOUNTABILI
- Page 122 and 123: PENNSYLVANIA HEAD START SUPPLEMENTA
- Page 124 and 125: NO PROGRAM uring the 2007-2008 scho
- Page 126 and 127: PERCENT OF STATE POPULATION ENROLLE
- Page 128 and 129: SOUTH CAROLINA HALF-DAY CHILD DEVEL
- Page 130 and 131: NO PROGRAM ACCESS RANKINGS 4-YEAR-O
- Page 132 and 133: PERCENT OF STATE POPULATION ENROLLE
- Page 134 and 135: PERCENT OF STATE POPULATION ENROLLE
- Page 136 and 137: NO PROGRAM ACCESS RANKINGS 4-YEAR-O
- Page 138 and 139: PERCENT OF STATE POPULATION ENROLLE
- Page 140 and 141: VERMONT PREKINDERGARTEN EDUCATION -
- Page 142 and 143: PERCENT OF STATE POPULATION ENROLLE
- Page 144 and 145: PERCENT OF STATE POPULATION ENROLLE
- Page 146 and 147: PERCENT OF STATE POPULATION ENROLLE
- Page 148 and 149: PERCENT OF STATE POPULATION ENROLLE
- Page 150 and 151: WISCONSIN FOUR-YEAR-OLD KINDERGARTE
- Page 152 and 153: NO PROGRAM ACCESS RANKINGS 4-YEAR-O
- Page 154 and 155: METHODOLOGY The data in this report
- Page 156 and 157: In the 2008 Yearbook, we attempt to
- Page 158 and 159:
APPENDIX A: STATE SURVEY DATA 2007-
- Page 160 and 161:
STATE ACCESS Number of children in
- Page 162 and 163:
STATE ACCESS Are children receiving
- Page 164 and 165:
STATE ACCESS Program enrollment - F
- Page 166 and 167:
STATE OPERATING SCHEDULE Minimum op
- Page 168 and 169:
STATE AGE ELIGIBILITY Minimum age f
- Page 170 and 171:
STATE AGE ELIGIBILITY State policy
- Page 172 and 173:
STATE INCOME REQUIREMENT Income req
- Page 174 and 175:
STATE OTHER ELIGIBILITY REQUIREMENT
- Page 176 and 177:
STATE OTHER ELIGIBILITY REQUIREMENT
- Page 178 and 179:
STATE PROGRAM STANDARDS Maximum cla
- Page 180 and 181:
STATE PROGRAM STANDARDS Support ser
- Page 182 and 183:
STATE PROGRAM STANDARDS Support ser
- Page 184 and 185:
STATE PROGRAM STANDARDS Alabama 2 N
- Page 186 and 187:
STATE STATEWIDE EARLY LEARNING STAN
- Page 188 and 189:
STATE STATEWIDE EARLY LEARNING STAN
- Page 190 and 191:
STATE STATEWIDE EARLY LEARNING STAN
- Page 192 and 193:
STATE PERSONNEL Minimum teacher deg
- Page 194 and 195:
STATE PERSONNEL Education level of
- Page 196 and 197:
STATE PERSONNEL Assistant teacher i
- Page 198 and 199:
STATE PERSONNEL State supports for
- Page 200 and 201:
STATE RESOURCES State funding sourc
- Page 202 and 203:
STATE RESOURCES Required local fund
- Page 204 and 205:
STATE RESOURCES Agencies eligible t
- Page 206 and 207:
STATE RESOURCES Is there a percenta
- Page 208 and 209:
STATE RESOURCES Are per-child/per-c
- Page 210 and 211:
STATE RESOURCES Can a child be fund
- Page 212 and 213:
STATE MONITORING Information collec
- Page 214 and 215:
STATE MONITORING How is monitoring
- Page 216 and 217:
STATE MONITORING What program recor
- Page 218 and 219:
STATE MONITORING How is information
- Page 220 and 221:
STATE Alabama Yes Specific assessme
- Page 222 and 223:
STATE MONITORING Required kindergar
- Page 224 and 225:
14 Children are assessed at three d
- Page 226 and 227:
DELAWARE - Early Childhood Assistan
- Page 228 and 229:
3 Kansas began a pre-K pilot that s
- Page 230 and 231:
7 While not required, most programs
- Page 232 and 233:
19 The formula uses free lunch and
- Page 234 and 235:
18 Evaluation of program-level outc
- Page 236 and 237:
13 The state allocates the same amo
- Page 238 and 239:
11 Beginning in 2009-2010, assistan
- Page 240 and 241:
20 The Office of Early Learning (OE
- Page 242 and 243:
WEST VIRGINIA - West Virginia Unive
- Page 244 and 245:
APPENDIX B: HEAD START DATA (contin
- Page 246 and 247:
APPENDIX C: CHILD CARE DATA STATE I
- Page 248 and 249:
APPENDIX C: CHILD CARE DATA (contin
- Page 250 and 251:
APPENDIX C: CHILD CARE DATA (contin
- Page 252 and 253:
APPENDIX E: PRE-K SPECIAL EDUCATION
- Page 254:
ISBN 0-9749910-5-8 $59.95