Report: The State of Preschool 2008: State Preschool Yearbook
Report: The State of Preschool 2008: State Preschool Yearbook
Report: The State of Preschool 2008: State Preschool Yearbook

Create successful ePaper yourself
Turn your PDF publications into a flip-book with our unique Google optimized e-Paper software.
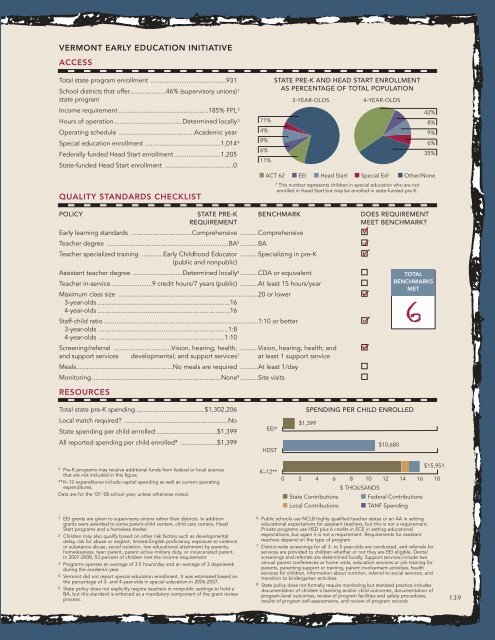
VERMONT EARLY EDUCATION INITIATIVE<br />
ACCESS<br />
Total state program enrollment ..........................................931<br />
School districts that <strong>of</strong>fer....................46% (supervisory unions) 1<br />
state program<br />
Income requirement ..................................................185% FPL 2<br />
Hours <strong>of</strong> operation ......................................Determined locally 3<br />
Operating schedule ..........................................Academic year<br />
Special education enrollment ..........................................1,014 4<br />
Federally funded Head Start enrollment ..........................1,205<br />
<strong>State</strong>-funded Head Start enrollment ......................................0<br />
QUALITY STANDARDS CHECKLIST<br />
STATE PRE-K AND HEAD START ENROLLMENT<br />
AS PERCENTAGE OF TOTAL POPULATION<br />
3-YEAR-OLDS<br />
4-YEAR-OLDS<br />
42%<br />
71% 8%<br />
4%<br />
9%<br />
8%<br />
6%<br />
6%<br />
35%<br />
11%<br />
■ ACT 62 ■ EEI ■ Head Start ■ Special Ed † ■ Other/None<br />
† This number represents children in special education who are not<br />
enrolled in Head Start but may be enrolled in state-funded pre-K.<br />
POLICY STATE PRE-K BENCHMARK DOES REQUIREMENT<br />
REQUIREMENT<br />
MEET BENCHMARK?<br />
Early learning standards ..................................Comprehensive ..........Comprehensive<br />
Teacher degree ....................................................................BA 5 ..........BA<br />
Teacher specialized training ............Early Childhood Educator ..........Specializing in pre-K<br />
(public and nonpublic)<br />
Assistant teacher degree ............................Determined locally 6 ..........CDA or equivalent<br />
Teacher in-service ......................9 credit hours/7 years (public) ..........At least 15 hours/year<br />
Maximum class size ..............................................................................20 or lower<br />
3-year-olds ..........................................................................16<br />
4-year-olds ..........................................................................16<br />
Staff-child ratio ......................................................................................1:10 or better<br />
3-year-olds ........................................................................1:8<br />
4-year-olds ......................................................................1:10<br />
Screening/referral ................................Vision, hearing, health, ..........Vision, hearing, health; and<br />
and support services developmental; and support services 7 at least 1 support service<br />
Meals......................................................No meals are required ..........At least 1/day<br />
Monitoring ........................................................................None 8 ..........Site visits<br />
RESOURCES<br />
TOTAL<br />
BENCHMARKS<br />
MET<br />
Total state pre-K spending ......................................$1,302,206<br />
Local match required? ............................................................No<br />
<strong>State</strong> spending per child enrolled ..................................$1,399<br />
All reported spending per child enrolled* ....................$1,399<br />
EEI*<br />
HDST<br />
SPENDING PER CHILD ENROLLED<br />
$1,399<br />
$10,680<br />
* Pre-K programs may receive additional funds from federal or local sources<br />
that are not included in this figure.<br />
** K–12 expenditures include capital spending as well as current operating<br />
expenditures.<br />
Data are for the ‘07-’08 school year, unless otherwise noted.<br />
K–12**<br />
0 2 4 6 8 10 12 14 16 18<br />
$ THOUSANDS<br />
■ <strong>State</strong> Contributions ■ Federal Contributions<br />
■ Local Contributions ■ TANF Spending<br />
$15,951<br />
1 EEI grants are given to supervisory unions rather than districts. In addition<br />
grants were awarded to some parent-child centers, child care centers, Head<br />
Start programs and a homeless shelter.<br />
2 Children may also qualify based on other risk factors such as developmental<br />
delay, risk for abuse or neglect, limited English pr<strong>of</strong>iciency, exposure to violence<br />
or substance abuse, social isolation, low educational attainment by parents,<br />
homelessness, teen parent, parent active military duty, or incarcerated parent.<br />
In 2007-<strong>2008</strong>, 53 percent <strong>of</strong> children met the income requirement.<br />
3 Programs operate an average <strong>of</strong> 3.5 hours/day and an average <strong>of</strong> 3 days/week<br />
during the academic year.<br />
4 Vermont did not report special education enrollment. It was estimated based on<br />
the percentage <strong>of</strong> 3- and 4-year-olds in special education in 2006-2007.<br />
5 <strong>State</strong> policy does not explicitly require teachers in nonpublic settings to hold a<br />
BA, but this standard is enforced as a mandatory component <strong>of</strong> the grant review<br />
process.<br />
6 Public schools use NCLB highly qualified teacher status or an AA in setting<br />
educational expectations for assistant teachers, but this is not a requirement.<br />
Private programs use HSD plus 6 credits in ECE in setting educational<br />
expectations, but again it is not a requirement. Requirements for assistant<br />
teachers depend on the type <strong>of</strong> program.<br />
7 District-wide screenings for all 3- to 5-year-olds are conducted, and referrals for<br />
services are provided to children whether or not they are EEI eligible. Dental<br />
screenings and referrals are determined locally. Support services include two<br />
annual parent conferences or home visits, education services or job training for<br />
parents, parenting support or training, parent involvement activities, health<br />
services for children, information about nutrition, referral to social services, and<br />
transition to kindergarten activities.<br />
8 <strong>State</strong> policy does not formally require monitoring but standard practice includes<br />
documentation <strong>of</strong> children's learning and/or child outcomes, documentation <strong>of</strong><br />
program-level outcomes, review <strong>of</strong> program facilities and safety procedures,<br />
results <strong>of</strong> program self-assessments, and review <strong>of</strong> program records.<br />
139