Report: The State of Preschool 2008: State Preschool Yearbook
Report: The State of Preschool 2008: State Preschool Yearbook
Report: The State of Preschool 2008: State Preschool Yearbook

You also want an ePaper? Increase the reach of your titles
YUMPU automatically turns print PDFs into web optimized ePapers that Google loves.
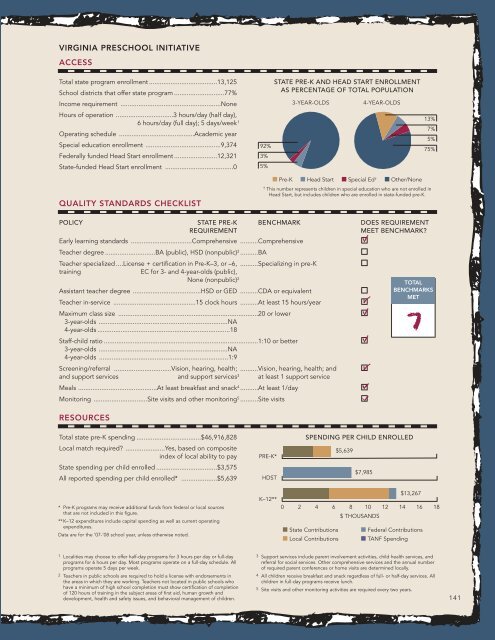
VIRGINIA PRESCHOOL INITIATIVE<br />
ACCESS<br />
Total state program enrollment ......................................13,125<br />
School districts that <strong>of</strong>fer state program ............................77%<br />
Income requirement ........................................................None<br />
Hours <strong>of</strong> operation ................................3 hours/day (half day),<br />
6 hours/day (full day); 5 days/week 1<br />
Operating schedule ..........................................Academic year<br />
Special education enrollment ..........................................9,374<br />
Federally funded Head Start enrollment ........................12,321<br />
<strong>State</strong>-funded Head Start enrollment ......................................0<br />
92%<br />
3%<br />
5%<br />
STATE PRE-K AND HEAD START ENROLLMENT<br />
AS PERCENTAGE OF TOTAL POPULATION<br />
3-YEAR-OLDS<br />
4-YEAR-OLDS<br />
13%<br />
7%<br />
5%<br />
75%<br />
QUALITY STANDARDS CHECKLIST<br />
■ Pre-K ■ Head Start ■ Special Ed † ■ Other/None<br />
† This number represents children in special education who are not enrolled in<br />
Head Start, but includes children who are enrolled in state-funded pre-K.<br />
POLICY STATE PRE-K BENCHMARK DOES REQUIREMENT<br />
REQUIREMENT<br />
MEET BENCHMARK?<br />
Early learning standards ..................................Comprehensive ..........Comprehensive<br />
Teacher degree ............................BA (public), HSD (nonpublic) 2 ..........BA<br />
Teacher specialized ....License + certification in Pre-K–3, or –6, ..........Specializing in pre-K<br />
training<br />
EC for 3- and 4-year-olds (public),<br />
None (nonpublic) 2<br />
Assistant teacher degree ......................................HSD or GED ..........CDA or equivalent<br />
Teacher in-service ..............................................15 clock hours ..........At least 15 hours/year<br />
Maximum class size ..............................................................................20 or lower<br />
3-year-olds ........................................................................NA<br />
4-year-olds ..........................................................................18<br />
Staff-child ratio ......................................................................................1:10 or better<br />
3-year-olds ........................................................................NA<br />
4-year-olds ........................................................................1:9<br />
Screening/referral ................................Vision, hearing, health; ..........Vision, hearing, health; and<br />
and support services and support services 3 at least 1 support service<br />
Meals ............................................At least breakfast and snack 4 ..........At least 1/day<br />
Monitoring ..............................Site visits and other monitoring 5 ..........Site visits<br />
RESOURCES<br />
TOTAL<br />
BENCHMARKS<br />
MET<br />
Total state pre-K spending ....................................$46,916,828<br />
Local match required? ......................Yes, based on composite<br />
index <strong>of</strong> local ability to pay<br />
<strong>State</strong> spending per child enrolled ..................................$3,575<br />
All reported spending per child enrolled* ....................$5,639<br />
* Pre-K programs may receive additional funds from federal or local sources<br />
that are not included in this figure.<br />
** K–12 expenditures include capital spending as well as current operating<br />
expenditures.<br />
Data are for the ‘07-’08 school year, unless otherwise noted.<br />
PRE-K*<br />
HDST<br />
K–12**<br />
SPENDING PER CHILD ENROLLED<br />
0 2 4 6 8 10 12 14 16 18<br />
■ <strong>State</strong> Contributions<br />
■ Local Contributions<br />
$5,639<br />
$7,985<br />
$ THOUSANDS<br />
$13,267<br />
■ Federal Contributions<br />
■ TANF Spending<br />
1 Localities may choose to <strong>of</strong>fer half-day programs for 3 hours per day or full-day<br />
programs for 6 hours per day. Most programs operate on a full-day schedule. All<br />
programs operate 5 days per week.<br />
2 Teachers in public schools are required to hold a license with endorsements in<br />
the areas in which they are working. Teachers not located in public schools who<br />
have a minimum <strong>of</strong> high school completion must show certification <strong>of</strong> completion<br />
<strong>of</strong> 120 hours <strong>of</strong> training in the subject areas <strong>of</strong> first aid, human growth and<br />
development, health and safety issues, and behavioral management <strong>of</strong> children.<br />
3 Support services include parent involvement activities, child health services, and<br />
referral for social services. Other comprehensive services and the annual number<br />
<strong>of</strong> required parent conferences or home visits are determined locally.<br />
4 All children receive breakfast and snack regardless <strong>of</strong> full- or half-day services. All<br />
children in full-day programs receive lunch.<br />
5 Site visits and other monitoring activities are required every two years.<br />
141