Report: The State of Preschool 2008: State Preschool Yearbook
Report: The State of Preschool 2008: State Preschool Yearbook
Report: The State of Preschool 2008: State Preschool Yearbook

Create successful ePaper yourself
Turn your PDF publications into a flip-book with our unique Google optimized e-Paper software.
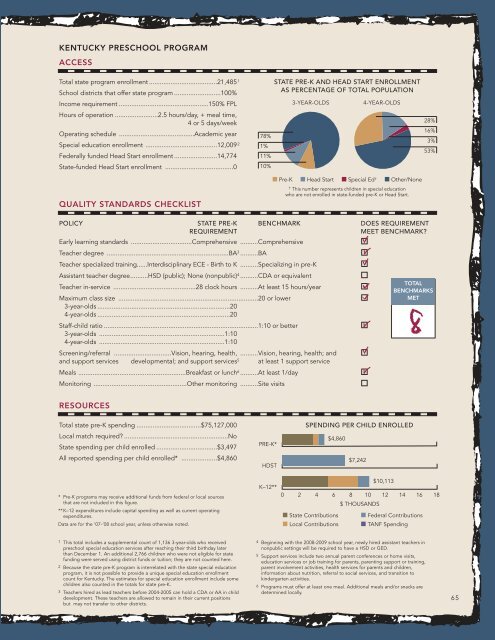
KENTUCKY PRESCHOOL PROGRAM<br />
ACCESS<br />
Total state program enrollment ......................................21,485 1<br />
School districts that <strong>of</strong>fer state program ..........................100%<br />
Income requirement ..................................................150% FPL<br />
Hours <strong>of</strong> operation ........................2.5 hours/day, + meal time,<br />
4 or 5 days/week<br />
Operating schedule ..........................................Academic year<br />
Special education enrollment ........................................12,009 2<br />
Federally funded Head Start enrollment ........................14,774<br />
<strong>State</strong>-funded Head Start enrollment ......................................0<br />
QUALITY STANDARDS CHECKLIST<br />
78%<br />
1%<br />
11%<br />
10%<br />
STATE PRE-K AND HEAD START ENROLLMENT<br />
AS PERCENTAGE OF TOTAL POPULATION<br />
3-YEAR-OLDS<br />
4-YEAR-OLDS<br />
■ Pre-K ■ Head Start ■ Special Ed † ■ Other/None<br />
† This number represents children in special education<br />
who are not enrolled in state-funded pre-K or Head Start.<br />
28%<br />
16%<br />
3%<br />
53%<br />
POLICY STATE PRE-K BENCHMARK DOES REQUIREMENT<br />
REQUIREMENT<br />
MEET BENCHMARK?<br />
Early learning standards ..................................Comprehensive ..........Comprehensive<br />
Teacher degree ....................................................................BA 3 ..........BA<br />
Teacher specialized training......Interdisciplinary ECE - Birth to K ..........Specializing in pre-K<br />
Assistant teacher degree..........HSD (public); None (nonpublic) 4 ..........CDA or equivalent<br />
Teacher in-service ..............................................28 clock hours ..........At least 15 hours/year<br />
Maximum class size ..............................................................................20 or lower<br />
3-year-olds ..........................................................................20<br />
4-year-olds ..........................................................................20<br />
Staff-child ratio ......................................................................................1:10 or better<br />
3-year-olds ......................................................................1:10<br />
4-year-olds ......................................................................1:10<br />
Screening/referral ................................Vision, hearing, health, ..........Vision, hearing, health; and<br />
and support services developmental; and support services 5 at least 1 support service<br />
Meals ............................................................Breakfast or lunch 6 ..........At least 1/day<br />
Monitoring ....................................................Other monitoring ..........Site visits<br />
TOTAL<br />
BENCHMARKS<br />
MET<br />
RESOURCES<br />
Total state pre-K spending ....................................$75,127,000<br />
Local match required? ..........................................................No<br />
<strong>State</strong> spending per child enrolled ..................................$3,497<br />
All reported spending per child enrolled* ....................$4,860<br />
PRE-K*<br />
HDST<br />
SPENDING PER CHILD ENROLLED<br />
$4,860<br />
$7,242<br />
* Pre-K programs may receive additional funds from federal or local sources<br />
that are not included in this figure.<br />
** K–12 expenditures include capital spending as well as current operating<br />
expenditures.<br />
Data are for the ‘07-’08 school year, unless otherwise noted.<br />
K–12**<br />
0 2 4 6 8 10 12 14 16 18<br />
■ <strong>State</strong> Contributions<br />
■ Local Contributions<br />
$ THOUSANDS<br />
$10,113<br />
■ Federal Contributions<br />
■ TANF Spending<br />
1 This total includes a supplemental count <strong>of</strong> 1,136 3-year-olds who received<br />
preschool special education services after reaching their third birthday later<br />
than December 1. An additional 2,766 children who were not eligible for state<br />
funding were served using district funds or tuition; they are not counted here.<br />
2 Because the state pre-K program is interrelated with the state special education<br />
program, it is not possible to provide a unique special education enrollment<br />
count for Kentucky. <strong>The</strong> estimates for special education enrollment include some<br />
children also counted in the totals for state pre-K.<br />
3 Teachers hired as lead teachers before 2004-2005 can hold a CDA or AA in child<br />
development. <strong>The</strong>se teachers are allowed to remain in their current positions<br />
but may not transfer to other districts.<br />
4 Beginning with the <strong>2008</strong>-2009 school year, newly hired assistant teachers in<br />
nonpublic settings will be required to have a HSD or GED.<br />
5 Support services include two annual parent conferences or home visits,<br />
education services or job training for parents, parenting support or training,<br />
parent involvement activities, health services for parents and children,<br />
information about nutrition, referral to social services, and transition to<br />
kindergarten activities.<br />
6 Programs must <strong>of</strong>fer at least one meal. Additional meals and/or snacks are<br />
determined locally.<br />
65