Report: The State of Preschool 2008: State Preschool Yearbook
Report: The State of Preschool 2008: State Preschool Yearbook
Report: The State of Preschool 2008: State Preschool Yearbook

Create successful ePaper yourself
Turn your PDF publications into a flip-book with our unique Google optimized e-Paper software.
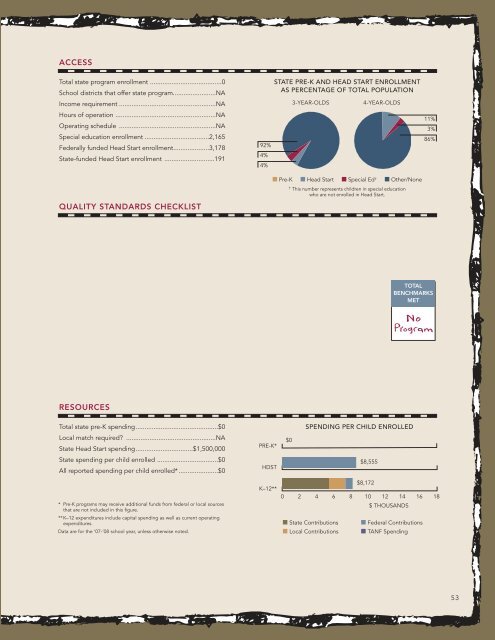
ACCESS<br />
Total state program enrollment ........................................0<br />
School districts that <strong>of</strong>fer state program........................NA<br />
Income requirement ......................................................NA<br />
Hours <strong>of</strong> operation ........................................................NA<br />
Operating schedule ......................................................NA<br />
Special education enrollment ....................................2,165<br />
Federally funded Head Start enrollment....................3,178<br />
<strong>State</strong>-funded Head Start enrollment ............................191<br />
QUALITY STANDARDS CHECKLIST<br />
92%<br />
4%<br />
4%<br />
STATE PRE-K AND HEAD START ENROLLMENT<br />
AS PERCENTAGE OF TOTAL POPULATION<br />
3-YEAR-OLDS<br />
4-YEAR-OLDS<br />
■ Pre-K ■ Head Start ■ Special Ed † ■ Other/None<br />
† This number represents children in special education<br />
who are not enrolled in Head Start.<br />
11%<br />
3%<br />
86%<br />
TOTAL<br />
BENCHMARKS<br />
MET<br />
RESOURCES<br />
Total state pre-K spending..............................................$0<br />
Local match required? ..................................................NA<br />
<strong>State</strong> Head Start spending................................$1,500,000<br />
<strong>State</strong> spending per child enrolled ..................................$0<br />
All reported spending per child enrolled* ......................$0<br />
PRE-K*<br />
HDST<br />
$0<br />
SPENDING PER CHILD ENROLLED<br />
$8,555<br />
* Pre-K programs may receive additional funds from federal or local sources<br />
that are not included in this figure.<br />
** K–12 expenditures include capital spending as well as current operating<br />
expenditures.<br />
Data are for the ‘07-’08 school year, unless otherwise noted.<br />
K–12**<br />
0 2 4 6 8 10 12 14 16 18<br />
■ <strong>State</strong> Contributions<br />
■ Local Contributions<br />
$8,172<br />
$ THOUSANDS<br />
■ Federal Contributions<br />
■ TANF Spending<br />
53