Report: The State of Preschool 2008: State Preschool Yearbook
Report: The State of Preschool 2008: State Preschool Yearbook
Report: The State of Preschool 2008: State Preschool Yearbook

You also want an ePaper? Increase the reach of your titles
YUMPU automatically turns print PDFs into web optimized ePapers that Google loves.
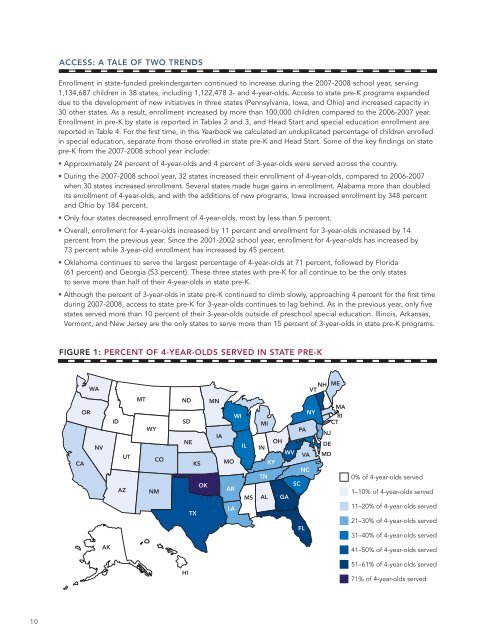
ACCESS: A TALE OF TWO TRENDS<br />
Enrollment in state-funded prekindergarten continued to increase during the 2007-<strong>2008</strong> school year, serving<br />
1,134,687 children in 38 states, including 1,122,478 3- and 4-year-olds. Access to state pre-K programs expanded<br />
due to the development <strong>of</strong> new initiatives in three states (Pennsylvania, Iowa, and Ohio) and increased capacity in<br />
30 other states. As a result, enrollment increased by more than 100,000 children compared to the 2006-2007 year.<br />
Enrollment in pre-K by state is reported in Tables 2 and 3, and Head Start and special education enrollment are<br />
reported in Table 4. For the first time, in this <strong>Yearbook</strong> we calculated an unduplicated percentage <strong>of</strong> children enrolled<br />
in special education, separate from those enrolled in state pre-K and Head Start. Some <strong>of</strong> the key findings on state<br />
pre-K from the 2007-<strong>2008</strong> school year include:<br />
• Approximately 24 percent <strong>of</strong> 4-year-olds and 4 percent <strong>of</strong> 3-year-olds were served across the country.<br />
• During the 2007-<strong>2008</strong> school year, 32 states increased their enrollment <strong>of</strong> 4-year-olds, compared to 2006-2007<br />
when 30 states increased enrollment. Several states made huge gains in enrollment. Alabama more than doubled<br />
its enrollment <strong>of</strong> 4-year-olds, and with the additions <strong>of</strong> new programs, Iowa increased enrollment by 348 percent<br />
and Ohio by 184 percent.<br />
• Only four states decreased enrollment <strong>of</strong> 4-year-olds, most by less than 5 percent.<br />
• Overall, enrollment for 4-year-olds increased by 11 percent and enrollment for 3-year-olds increased by 14<br />
percent from the previous year. Since the 2001-2002 school year, enrollment for 4-year-olds has increased by<br />
73 percent while 3-year-old enrollment has increased by 45 percent.<br />
• Oklahoma continues to serve the largest percentage <strong>of</strong> 4-year-olds at 71 percent, followed by Florida<br />
(61 percent) and Georgia (53 percent). <strong>The</strong>se three states with pre-K for all continue to be the only states<br />
to serve more than half <strong>of</strong> their 4-year-olds in state pre-K.<br />
• Although the percent <strong>of</strong> 3-year-olds in state pre-K continued to climb slowly, approaching 4 percent for the first time<br />
during 2007-<strong>2008</strong>, access to state pre-K for 3-year-olds continues to lag behind. As in the previous year, only five<br />
states served more than 10 percent <strong>of</strong> their 3-year-olds outside <strong>of</strong> preschool special education. Illinois, Arkansas,<br />
Vermont, and New Jersey are the only states to serve more than 15 percent <strong>of</strong> 3-year-olds in state pre-K programs.<br />
FIGURE 1: PERCENT OF 4-YEAR-OLDS SERVED IN STATE PRE-K<br />
WA<br />
OR<br />
NV<br />
CA<br />
ID<br />
UT<br />
AZ<br />
MT<br />
WY<br />
CO<br />
NM<br />
VT NH<br />
ND MN<br />
NY<br />
WI<br />
SD<br />
MI<br />
PA<br />
IA<br />
NE<br />
OH<br />
IL IN<br />
WV<br />
VA<br />
KS MO<br />
KY<br />
NC<br />
TN<br />
OK<br />
SC<br />
AR<br />
MS AL GA<br />
LA<br />
TX<br />
FL<br />
NJ<br />
DE<br />
MD<br />
ME<br />
MA<br />
RI<br />
CT<br />
0% <strong>of</strong> 4-year-olds served<br />
1–10% <strong>of</strong> 4-year-olds served<br />
11–20% <strong>of</strong> 4-year-olds served<br />
21–30% <strong>of</strong> 4-year-olds served<br />
31–40% <strong>of</strong> 4-year-olds served<br />
AK<br />
41–50% <strong>of</strong> 4-year-olds served<br />
HI<br />
51–61% <strong>of</strong> 4-year-olds served<br />
71% <strong>of</strong> 4-year-olds served<br />
10