RiskMetrics⢠âTechnical Document
RiskMetrics⢠âTechnical Document
RiskMetrics⢠âTechnical Document
Create successful ePaper yourself
Turn your PDF publications into a flip-book with our unique Google optimized e-Paper software.
x<br />
List of charts<br />
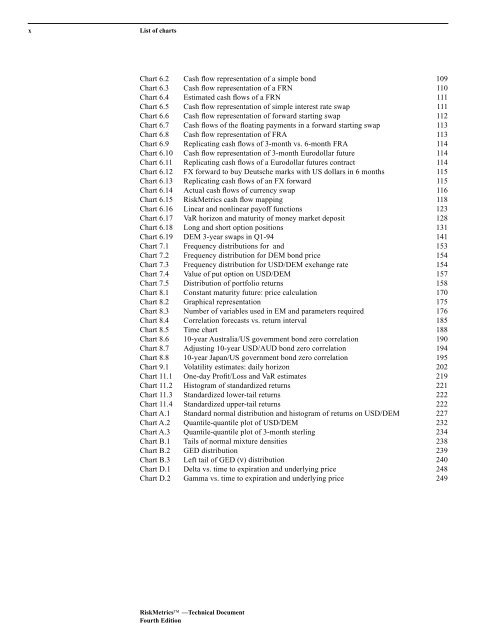
Chart 6.2 Cash flow representation of a simple bond 109<br />
Chart 6.3 Cash flow representation of a FRN 110<br />
Chart 6.4 Estimated cash flows of a FRN 111<br />
Chart 6.5 Cash flow representation of simple interest rate swap 111<br />
Chart 6.6 Cash flow representation of forward starting swap 112<br />
Chart 6.7 Cash flows of the floating payments in a forward starting swap 113<br />
Chart 6.8 Cash flow representation of FRA 113<br />
Chart 6.9 Replicating cash flows of 3-month vs. 6-month FRA 114<br />
Chart 6.10 Cash flow representation of 3-month Eurodollar future 114<br />
Chart 6.11 Replicating cash flows of a Eurodollar futures contract 114<br />
Chart 6.12 FX forward to buy Deutsche marks with US dollars in 6 months 115<br />
Chart 6.13 Replicating cash flows of an FX forward 115<br />
Chart 6.14 Actual cash flows of currency swap 116<br />
Chart 6.15 RiskMetrics cash flow mapping 118<br />
Chart 6.16 Linear and nonlinear payoff functions 123<br />
Chart 6.17 VaR horizon and maturity of money market deposit 128<br />
Chart 6.18 Long and short option positions 131<br />
Chart 6.19 DEM 3-year swaps in Q1-94 141<br />
Chart 7.1 Frequency distributions for and 153<br />
Chart 7.2 Frequency distribution for DEM bond price 154<br />
Chart 7.3 Frequency distribution for USD/DEM exchange rate 154<br />
Chart 7.4 Value of put option on USD/DEM 157<br />
Chart 7.5 Distribution of portfolio returns 158<br />
Chart 8.1 Constant maturity future: price calculation 170<br />
Chart 8.2 Graphical representation 175<br />
Chart 8.3 Number of variables used in EM and parameters required 176<br />
Chart 8.4 Correlation forecasts vs. return interval 185<br />
Chart 8.5 Time chart 188<br />
Chart 8.6 10-year Australia/US government bond zero correlation 190<br />
Chart 8.7 Adjusting 10-year USD/AUD bond zero correlation 194<br />
Chart 8.8 10-year Japan/US government bond zero correlation 195<br />
Chart 9.1 Volatility estimates: daily horizon 202<br />
Chart 11.1 One-day Profit/Loss and VaR estimates 219<br />
Chart 11.2 Histogram of standardized returns 221<br />
Chart 11.3 Standardized lower-tail returns 222<br />
Chart 11.4 Standardized upper-tail returns 222<br />
Chart A.1 Standard normal distribution and histogram of returns on USD/DEM 227<br />
Chart A.2 Quantile-quantile plot of USD/DEM 232<br />
Chart A.3 Quantile-quantile plot of 3-month sterling 234<br />
Chart B.1 Tails of normal mixture densities 238<br />
Chart B.2 GED distribution 239<br />
Chart B.3 Left tail of GED (ν) distribution 240<br />
Chart D.1 Delta vs. time to expiration and underlying price 248<br />
Chart D.2 Gamma vs. time to expiration and underlying price 249<br />
RiskMetrics —Technical <strong>Document</strong><br />
Fourth Edition


