RiskMetrics⢠âTechnical Document
RiskMetrics⢠âTechnical Document
RiskMetrics⢠âTechnical Document

Create successful ePaper yourself
Turn your PDF publications into a flip-book with our unique Google optimized e-Paper software.
60 Chapter 4. Statistical and probability foundations<br />
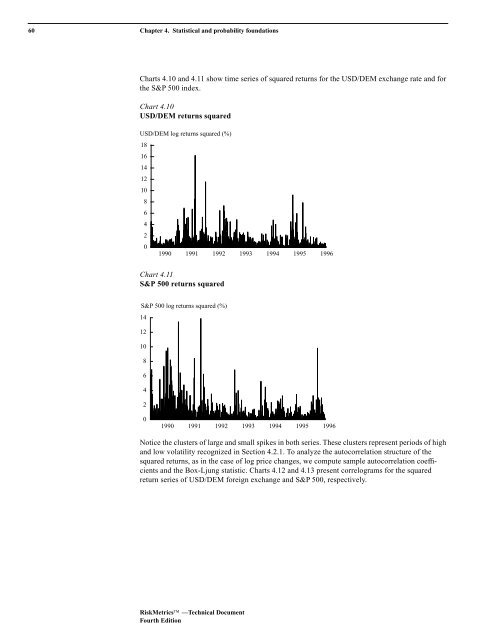
Charts 4.10 and 4.11 show time series of squared returns for the USD/DEM exchange rate and for<br />
the S&P 500 index.<br />
Chart 4.10<br />
USD/DEM returns squared<br />
USD/DEM log returns squared (%)<br />
18<br />
16<br />
14<br />
12<br />
10<br />
8<br />
6<br />
4<br />
2<br />
0<br />
1990 1991 1992 1993 1994 1995 1996<br />
Chart 4.11<br />
S&P 500 returns squared<br />
S&P 500 log returns squared (%)<br />
14<br />
12<br />
10<br />
8<br />
6<br />
4<br />
2<br />
0<br />
1990 1991 1992 1993 1994 1995 1996<br />
Notice the clusters of large and small spikes in both series. These clusters represent periods of high<br />
and low volatility recognized in Section 4.2.1. To analyze the autocorrelation structure of the<br />
squared returns, as in the case of log price changes, we compute sample autocorrelation coefficients<br />
and the Box-Ljung statistic. Charts 4.12 and 4.13 present correlograms for the squared<br />
return series of USD/DEM foreign exchange and S&P 500, respectively.<br />
RiskMetrics —Technical <strong>Document</strong><br />
Fourth Edition