RiskMetrics⢠âTechnical Document
RiskMetrics⢠âTechnical Document
RiskMetrics⢠âTechnical Document

You also want an ePaper? Increase the reach of your titles
YUMPU automatically turns print PDFs into web optimized ePapers that Google loves.
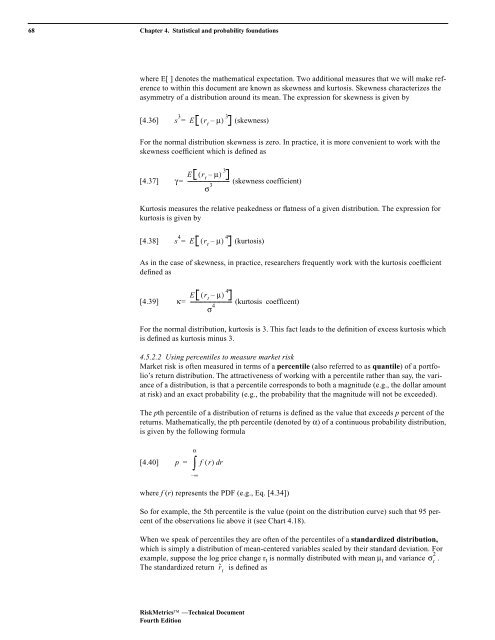
68 Chapter 4. Statistical and probability foundations<br />
where E[ ] denotes the mathematical expectation. Two additional measures that we will make reference<br />
to within this document are known as skewness and kurtosis. Skewness characterizes the<br />
asymmetry of a distribution around its mean. The expression for skewness is given by<br />
[4.36]<br />
s 3 = E ( r t<br />
– µ ) 3 (skewness)<br />
For the normal distribution skewness is zero. In practice, it is more convenient to work with the<br />
skewness coefficient which is defined as<br />
[4.37]<br />
γ =<br />
E ( r t<br />
– µ ) 3<br />
-------------------------------- (skewness coefficient)<br />
σ 3<br />
Kurtosis measures the relative peakedness or flatness of a given distribution. The expression for<br />
kurtosis is given by<br />
[4.38]<br />
s 4 = E ( r t<br />
– µ ) 4 (kurtosis)<br />
As in the case of skewness, in practice, researchers frequently work with the kurtosis coefficient<br />
defined as<br />
[4.39]<br />
κ=<br />
E ( r t<br />
– µ ) 4<br />
-------------------------------- (kurtosis coefficent)<br />
σ 4<br />
For the normal distribution, kurtosis is 3. This fact leads to the definition of excess kurtosis which<br />
is defined as kurtosis minus 3.<br />
4.5.2.2 Using percentiles to measure market risk<br />
Market risk is often measured in terms of a percentile (also referred to as quantile) of a portfolio’s<br />
return distribution. The attractiveness of working with a percentile rather than say, the variance<br />
of a distribution, is that a percentile corresponds to both a magnitude (e.g., the dollar amount<br />
at risk) and an exact probability (e.g., the probability that the magnitude will not be exceeded).<br />
The pth percentile of a distribution of returns is defined as the value that exceeds p percent of the<br />
returns. Mathematically, the pth percentile (denoted by α) of a continuous probability distribution,<br />
is given by the following formula<br />
[4.40]<br />
α<br />
∫<br />
p = f ( r) dr<br />
–∞<br />
where f (r) represents the PDF (e.g., Eq. [4.34])<br />
So for example, the 5th percentile is the value (point on the distribution curve) such that 95 percent<br />
of the observations lie above it (see Chart 4.18).<br />
When we speak of percentiles they are often of the percentiles of a standardized distribution,<br />
which is simply a distribution of mean-centered variables scaled by their standard deviation. For<br />
2<br />
example, suppose the log price change r t is normally distributed with mean µ t and variance σ t<br />
.<br />
The standardized return r˜t is defined as<br />
RiskMetrics —Technical <strong>Document</strong><br />
Fourth Edition