RiskMetrics⢠âTechnical Document
RiskMetrics⢠âTechnical Document
RiskMetrics⢠âTechnical Document

Create successful ePaper yourself
Turn your PDF publications into a flip-book with our unique Google optimized e-Paper software.
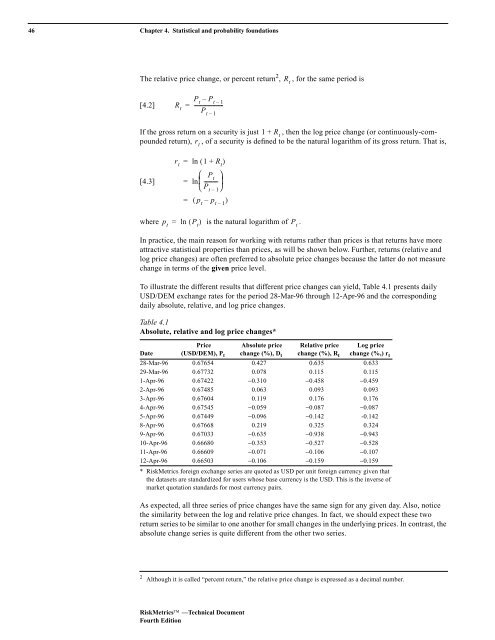
46 Chapter 4. Statistical and probability foundations<br />
The relative price change, or percent return 2 ,<br />
R t<br />
, for the same period is<br />
[4.2]<br />
P<br />
R t<br />
– P t – 1<br />
t<br />
= ----------------------<br />
P t – 1<br />
If the gross return on a security is just 1 + R t<br />
, then the log price change (or continuously-compounded<br />
return), , of a security is defined to be the natural logarithm of its gross return. That is,<br />
r t<br />
[4.3]<br />
r t<br />
= ln ( 1 + R t<br />
)<br />
=<br />
⎛ P t<br />
⎞<br />
ln⎜-----------<br />
⎟<br />
⎝P t – 1 ⎠<br />
= ( p t<br />
– p t – 1<br />
)<br />
where p t<br />
= ln ( P t<br />
) is the natural logarithm of P t<br />
.<br />
In practice, the main reason for working with returns rather than prices is that returns have more<br />
attractive statistical properties than prices, as will be shown below. Further, returns (relative and<br />
log price changes) are often preferred to absolute price changes because the latter do not measure<br />
change in terms of the given price level.<br />
To illustrate the different results that different price changes can yield, Table 4.1 presents daily<br />
USD/DEM exchange rates for the period 28-Mar-96 through 12-Apr-96 and the corresponding<br />
daily absolute, relative, and log price changes.<br />
Table 4.1<br />
Absolute, relative and log price changes*<br />
Date<br />
Price<br />
(USD/DEM), P t<br />
Absolute price<br />
change (%), D t<br />
Relative price<br />
change (%), R t<br />
Log price<br />
change (%,) r t<br />
28-Mar-96 0.67654 0.427 0.635 0.633<br />
29-Mar-96 0.67732 0.078 0.115 0.115<br />
1-Apr-96 0.67422 −0.310 −0.458 −0.459<br />
2-Apr-96 0.67485 0.063 0.093 0.093<br />
3-Apr-96 0.67604 0.119 0.176 0.176<br />
4-Apr-96 0.67545 −0.059 −0.087 −0.087<br />
5-Apr-96 0.67449 −0.096 −0.142 -0.142<br />
8-Apr-96 0.67668 0.219 0.325 0.324<br />
9-Apr-96 0.67033 −0.635 −0.938 −0.943<br />
10-Apr-96 0.66680 −0.353 −0.527 −0.528<br />
11-Apr-96 0.66609 −0.071 −0.106 −0.107<br />
12-Apr-96 0.66503 −0.106 −0.159 −0.159<br />
* RiskMetrics foreign exchange series are quoted as USD per unit foreign currency given that<br />
the datasets are standardized for users whose base currency is the USD. This is the inverse of<br />
market quotation standards for most currency pairs.<br />
As expected, all three series of price changes have the same sign for any given day. Also, notice<br />
the similarity between the log and relative price changes. In fact, we should expect these two<br />
return series to be similar to one another for small changes in the underlying prices. In contrast, the<br />
absolute change series is quite different from the other two series.<br />
2 Although it is called “percent return,” the relative price change is expressed as a decimal number.<br />
RiskMetrics —Technical <strong>Document</strong><br />
Fourth Edition