RiskMetrics⢠âTechnical Document
RiskMetrics⢠âTechnical Document
RiskMetrics⢠âTechnical Document

Create successful ePaper yourself
Turn your PDF publications into a flip-book with our unique Google optimized e-Paper software.
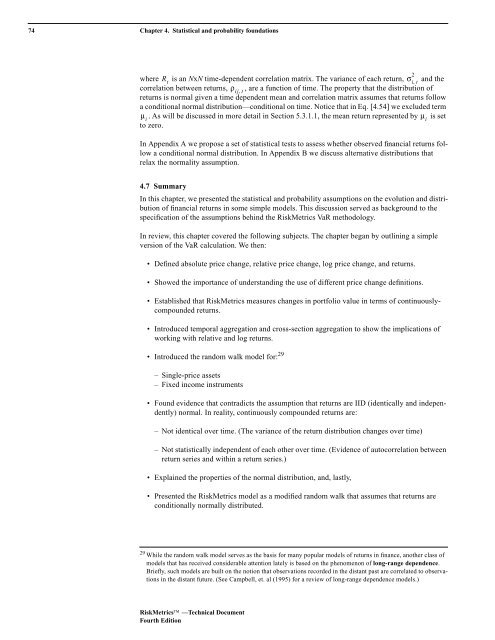
74 Chapter 4. Statistical and probability foundations<br />
where R t<br />
is an NxN time-dependent correlation matrix. The variance of each return, σ it ,<br />
and the<br />
correlation between returns, ρ ij,<br />
t<br />
, are a function of time. The property that the distribution of<br />
returns is normal given a time dependent mean and correlation matrix assumes that returns follow<br />
a conditional normal distribution—conditional on time. Notice that in Eq. [4.54] we excluded term<br />
µ i<br />
. As will be discussed in more detail in Section 5.3.1.1, the mean return represented by µ i<br />
is set<br />
to zero.<br />
In Appendix A we propose a set of statistical tests to assess whether observed financial returns follow<br />
a conditional normal distribution. In Appendix B we discuss alternative distributions that<br />
relax the normality assumption.<br />
2<br />
4.7 Summary<br />
In this chapter, we presented the statistical and probability assumptions on the evolution and distribution<br />
of financial returns in some simple models. This discussion served as background to the<br />
specification of the assumptions behind the RiskMetrics VaR methodology.<br />
In review, this chapter covered the following subjects. The chapter began by outlining a simple<br />
version of the VaR calculation. We then:<br />
• Defined absolute price change, relative price change, log price change, and returns.<br />
• Showed the importance of understanding the use of different price change definitions.<br />
• Established that RiskMetrics measures changes in portfolio value in terms of continuouslycompounded<br />
returns.<br />
• Introduced temporal aggregation and cross-section aggregation to show the implications of<br />
working with relative and log returns.<br />
• Introduced the random walk model for: 29<br />
– Single-price assets<br />
– Fixed income instruments<br />
• Found evidence that contradicts the assumption that returns are IID (identically and independently)<br />
normal. In reality, continuously compounded returns are:<br />
– Not identical over time. (The variance of the return distribution changes over time)<br />
– Not statistically independent of each other over time. (Evidence of autocorrelation between<br />
return series and within a return series.)<br />
• Explained the properties of the normal distribution, and, lastly,<br />
• Presented the RiskMetrics model as a modified random walk that assumes that returns are<br />
conditionally normally distributed.<br />
29 While the random walk model serves as the basis for many popular models of returns in finance, another class of<br />
models that has received considerable attention lately is based on the phenomenon of long-range dependence.<br />
Briefly, such models are built on the notion that observations recorded in the distant past are correlated to observations<br />
in the distant future. (See Campbell, et. al (1995) for a review of long-range dependence models.)<br />
RiskMetrics —Technical <strong>Document</strong><br />
Fourth Edition