- Page 1 and 2:
Wyoming Water Development Commissio
- Page 3 and 4:
Wyoming Framework Water Plan Volume
- Page 5 and 6:
TABLE OF CONTENTS 1.0-INTRODUCTION
- Page 7 and 8:
Surface Water…………………
- Page 9 and 10:
7.1.4 Supply Estimates…………
- Page 11 and 12:
8.6.3 Needs …………………
- Page 13 and 14:
List of Tables Table 1-1 Basin Plan
- Page 15 and 16:
List of Figures Figure 2-1 Snapshot
- Page 17 and 18:
1.0 INTRODUCTION 1.1 OVERVIEW This
- Page 19 and 20:
1.0 INTRODUCTION 1.3 BASIN PLANS Mo
- Page 21 and 22:
2.0 WEB TOOL Figure 2-1. Snapshot o
- Page 23 and 24:
3.0 SETTING Table 3-1 Landownership
- Page 25 and 26:
3.0 SETTING 3.1.3 Climate Wyoming
- Page 27 and 28:
3.0 SETTING Table 3-3 Basin Area Po
- Page 29 and 30:
3.0 SETTING Table 3-5 2004 Populati
- Page 31 and 32:
3.0 SETTING Livestock As of 2004, t
- Page 33 and 34:
3.0 SETTING Almanac, 2006). This in
- Page 35 and 36:
3.0 SETTING The key elements of Wyo
- Page 37 and 38:
3.0 SETTING administered on a strai
- Page 39 and 40:
3.0 SETTING It also limits Colorado
- Page 41 and 42:
3.0 SETTING (iii) Approximately 34,
- Page 43 and 44:
3.0 SETTING the award was for use i
- Page 45 and 46:
3.0 SETTING obligations of Wyoming
- Page 47 and 48:
3.0 SETTING aesthetically pleasing,
- Page 49 and 50:
3.0 SETTING Table 3-9 Drinking Wate
- Page 51 and 52:
3.0 SETTING species. If a federal a
- Page 53:
WYOMING - Headwaters of the West! S
- Page 57: FRANNIE DEAVER COWLEY LOVELL BYRON
- Page 61: 3-36
- Page 65: 3-38
- Page 68 and 69: 4.0 RESOURCES 4.3 SURFACE WATER RES
- Page 70 and 71: 4.0 RESOURCES Table 4-2 Recommended
- Page 72 and 73: 4.0 RESOURCES Major Aquifers Alluvi
- Page 74 and 75: 4.0 RESOURCES suggest an aquifer gr
- Page 76 and 77: 4.0 RESOURCES very low solubilities
- Page 79: 4-12
- Page 83: Tongue River Clarks Fork Belle Four
- Page 87: Wind River Below Boysen Reservoir B
- Page 91: 4-18
- Page 95: Thickness, ft TDS, mg/L BE GR NE PL
- Page 99: 4-22
- Page 103 and 104: 5.0 USE 5.1 INTRODUCTION This chapt
- Page 105 and 106: 5.0 USE Table 5-1 Irrigated Acreage
- Page 107: 5.0 USE beets, and beans are grown.
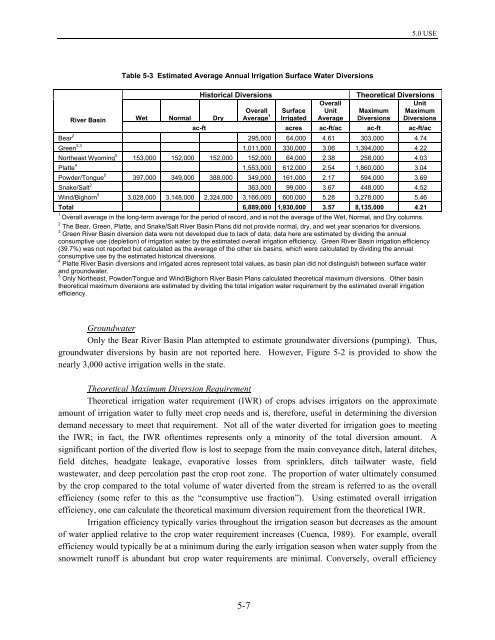
- Page 111 and 112: 5.0 USE Table 5-4 Estimated Average
- Page 113 and 114: 5.0 USE than existing demands. Addi
- Page 115 and 116: 5.0 USE The amount of industrial wa
- Page 117 and 118: 5.0 USE 5.5 RECREATIONAL WATER USE
- Page 119 and 120: 5.0 USE A quality boating experienc
- Page 121 and 122: 5.0 USE numbers of people bound for
- Page 123 and 124: 5.0 USE The first filings in Wyomin
- Page 125: 5.0 USE human activities (e.g., imp
- Page 129: FRANNIE RANCHESTER DEAVER COWLEY DA
- Page 133: FRANNIE RANCHESTER DEAVER COWLEY PA
- Page 137: FRANNIE Wind/Bighorn RANCHESTER DEA
- Page 141: Wind/Bighorn PARK ! Buffalo Bill Me
- Page 145: 1 Basin Map Number Stream Basin Map
- Page 149 and 150: 6.0 PROJECTIONS This chapter presen
- Page 151 and 152: 6.0 PROJECTIONS Wind/Bighorn River
- Page 153 and 154: 6.0 PROJECTIONS The CIR or use for
- Page 155 and 156: 6.0 PROJECTIONS Table 6-5 Summary o
- Page 157 and 158: 6.0 PROJECTIONS These three methods
- Page 159 and 160:
6.0 PROJECTIONS Table 6-8 Projected
- Page 161 and 162:
6.0 PROJECTIONS Wyoming. Under all
- Page 163 and 164:
6.0 PROJECTIONS The Platte River Ba
- Page 165 and 166:
6.0 PROJECTIONS discharged. The com
- Page 167 and 168:
6.0 PROJECTIONS water is used in so
- Page 169 and 170:
6.0 PROJECTIONS River Basin. Severa
- Page 171 and 172:
6.0 PROJECTIONS Projections of popu
- Page 173 and 174:
6.0 PROJECTIONS withstand without s
- Page 175 and 176:
6.0 PROJECTIONS permitting document
- Page 177 and 178:
6.0 PROJECTIONS Table 6-14 Projecte
- Page 180:
Powell Polecat Bench Byron Lovell N
- Page 184:
6-33
- Page 188:
6-35
- Page 191 and 192:
7.0 AVAILABILITY minimized to the e
- Page 193 and 194:
7.0 AVAILABILITY Reach Gain/Loss Th
- Page 195 and 196:
7.0 AVAILABILITY hydrologic conditi
- Page 197 and 198:
7.0 AVAILABILITY Table 7-2 Availabl
- Page 199 and 200:
7.0 AVAILABILITY quality, whereas a
- Page 201 and 202:
7.0 AVAILABILITY River Basins. The
- Page 203 and 204:
7.0 AVAILABILITY 7.2.6 Basin Summar
- Page 205 and 206:
7.0 AVAILABILITY ! Increase support
- Page 207:
7.0 AVAILABILITY Fencing to keep ca
- Page 211:
I D A H O JACKSON Note: The Physica
- Page 215:
Dry: 0K Normal: 50K Wet: 100K # CAM
- Page 219:
M O N T A N A Note: The Physically
- Page 223:
FRANNIE DEAVER COWLEY LOVELL BYRON
- Page 226 and 227:
8.0 OPPORTUNITIES 8.2.2 Short List
- Page 228 and 229:
8.0 OPPORTUNITIES are needs for sup
- Page 230 and 231:
8.0 OPPORTUNITIES The West Fork pro
- Page 232 and 233:
8.0 OPPORTUNITIES 8.3.9 Future Grou
- Page 234 and 235:
8.0 OPPORTUNITIES Table 8-5 Evaluat
- Page 236 and 237:
8.0 OPPORTUNITIES 8.4.6 Supplementa
- Page 238 and 239:
8.0 OPPORTUNITIES Table 8-7 Framewo
- Page 240 and 241:
8.0 OPPORTUNITIES Cottonwood Creek
- Page 242 and 243:
8.0 OPPORTUNITIES Table 8-8 Apporti
- Page 244 and 245:
8.0 OPPORTUNITIES Table 8-10 Evalua
- Page 246 and 247:
8.0 OPPORTUNITIES 8.5.6 Supplementa
- Page 248 and 249:
8.0 OPPORTUNITIES Table 8-12 Framew
- Page 250 and 251:
8.0 OPPORTUNITIES 8.5.8 Recommendat
- Page 252 and 253:
8.0 OPPORTUNITIES Table 8-14 Platte
- Page 254 and 255:
8.0 OPPORTUNITIES 8.6.6 Structural
- Page 256 and 257:
8.0 OPPORTUNITIES Water Diversions
- Page 258 and 259:
8.0 OPPORTUNITIES transfer the hist
- Page 260 and 261:
8.0 OPPORTUNITIES 8.7.4 Long List o
- Page 262 and 263:
8.0 OPPORTUNITIES Table 8-18 Evalua
- Page 264 and 265:
8.0 OPPORTUNITIES Table 8-20 Evalua
- Page 266 and 267:
8.0 OPPORTUNITIES Table 8-22 Evalua
- Page 268 and 269:
8.0 OPPORTUNITIES Reservoir, North
- Page 270 and 271:
8.0 OPPORTUNITIES Table 8-25 Evalua
- Page 272 and 273:
8.0 OPPORTUNITIES Agricultural Oppo
- Page 274 and 275:
8.0 OPPORTUNITIES The current and p
- Page 276 and 277:
8.0 OPPORTUNITIES Table 8-28 Short
- Page 278 and 279:
8.0 OPPORTUNITIES Table 8-29 Evalua
- Page 280 and 281:
8.0 OPPORTUNITIES Cottonwood/Grass
- Page 282 and 283:
8.0 OPPORTUNITIES 8.9.8 Recommendat
- Page 284 and 285:
8.0 OPPORTUNITIES ! The Madison Aqu
- Page 287:
JACKSON TETON ALPINE PAVILLION RIVE
- Page 291:
Cheyenne River M O N T A N A Little
- Page 295:
Lamar River M O N T A N A PARK Snak
- Page 299 and 300:
9.0 PROJECT FUNDING 9.1 INTRODUCTIO
- Page 301 and 302:
9.0 PROJECT FUNDING Projects begin
- Page 303 and 304:
GLOSSARY acre-foot aquifer aquitard
- Page 305 and 306:
head hydrogeology hydrology industr
- Page 307:
till transmissivity unconfined cond
- Page 310 and 311:
OGCC PAM PIA PRRIP PRSB SCS SEO SLI
- Page 312 and 313:
Environmental Use, 3-12, 5-1, 5-19,
- Page 314 and 315:
Storage, 1-2, 3-15, 3-16, 3-17, 3-1
- Page 316 and 317:
This report was prepared by: Consul
- Page 318 and 319:
I, Murray T. Schroeder, a Wyoming r
- Page 320 and 321:
LIST OF TABLES Table 1 Summary of I
- Page 323 and 324:
2.0 INFORMATION AND DATA 2.0 INFORM
- Page 325 and 326:
2.0 INFORMATION AND DATA As expecte
- Page 327 and 328:
2.0 INFORMATION AND DATA 2.3.1 Audi
- Page 329 and 330:
2.0 INFORMATION AND DATA The poor r
- Page 331 and 332:
3.0 RECOMMENDATIONS FOR FUTURE PLAN
- Page 333 and 334:
3.0 RECOMMENDATIONS FOR FUTURE PLAN
- Page 335:
3.0 RECOMMENDATIONS FOR FUTURE PLAN
- Page 338 and 339:
4.0 AGENCY PLANNING RECOMMENDATIONS
- Page 340 and 341:
4.0 AGENCY PLANNING RECOMMENDATIONS
- Page 342 and 343:
4.0 AGENCY PLANNING RECOMMENDATIONS
- Page 344 and 345:
4.0 AGENCY PLANNING RECOMMENDATIONS
- Page 346 and 347:
4.0 AGENCY PLANNING RECOMMENDATIONS
- Page 348 and 349:
5.0 SUMMARY OF ISSUES AND RECOMMEND
- Page 350 and 351:
5.0 SUMMARY OF ISSUES AND RECOMMEND
- Page 353:
BEAR RIVER BASIN
- Page 356 and 357:
Basin Planning Process Wyoming is u
- Page 358 and 359:
The Bear River Compact divides the
- Page 360 and 361:
Figure 2 shows the average annual b
- Page 362 and 363:
The following summarizes the Upper
- Page 364 and 365:
High Case Scenario Total basin wate
- Page 366 and 367:
investigations did not result in th
- Page 369 and 370:
1 of 2 Issues identified in the Bea
- Page 371:
GREEN RIVER BASIN
- Page 374 and 375:
Executive Summary, Green River Basi
- Page 376 and 377:
Executive Summary, Green River Basi
- Page 378 and 379:
Executive Summary, Green River Basi
- Page 380 and 381:
Executive Summary, Green River Basi
- Page 382 and 383:
Executive Summary, Green River Basi
- Page 384 and 385:
Executive Summary, Green River Basi
- Page 386 and 387:
Issues identified in the Green Rive
- Page 389:
NORTHEAST RIVER BASIN
- Page 393 and 394:
Northeast Wyoming River Basins Plan
- Page 395 and 396:
Northeast Wyoming River Basins Plan
- Page 397 and 398:
Northeast Wyoming River Basins Plan
- Page 399 and 400:
Northeast Wyoming River Basins Plan
- Page 401 and 402:
Northeast Wyoming River Basins Plan
- Page 403 and 404:
Northeast Wyoming River Basins Plan
- Page 405:
Northeast Wyoming River Basins Plan
- Page 408 and 409:
Issues identified in the Northeast
- Page 414 and 415:
TABLE OF CONTENTS E X E C U T I V E
- Page 416 and 417:
P L A T T E R I V E R B A S I N P R
- Page 418 and 419:
P L A T T E R I V E R B A S I N P R
- Page 420 and 421:
P L A T T E R I V E R B A S I N P R
- Page 422 and 423:
P L A T T E R I V E R B A S I N P R
- Page 424 and 425:
P L A T T E R I V E R B A S I N P R
- Page 426 and 427:
P L A T T E R I V E R B A S I N P R
- Page 428 and 429:
P L A T T E R I V E R B A S I N P R
- Page 430 and 431:
Page 2 of 4 Issues identified in th
- Page 432 and 433:
Page 4 of 4 Priorities for Platte R
- Page 435:
Powder/Tongue River Basin Plan Exec
- Page 438 and 439:
Executive Summary Powder/Tongue Riv
- Page 440 and 441:
Powder/Tongue River Basin Plan - Ex
- Page 442 and 443:
Powder/Tongue River Basin Plan - Ex
- Page 444 and 445:
Powder/Tongue River Basin Plan - Ex
- Page 446 and 447:
Powder/Tongue River Basin Plan - Ex
- Page 448 and 449:
Powder/Tongue River Basin Plan - Ex
- Page 451 and 452:
1 of 5 Issues identified in the Pow
- Page 453 and 454:
3 of 5 Issues identified in the Pow
- Page 455:
5 of 5 Issues identified in the Pow
- Page 459 and 460:
SNAKE /SALT RIVER BASIN PLAN EXECUT
- Page 462 and 463:
Executive Summary Climate in the ba
- Page 464 and 465:
Executive Summary cipitation. These
- Page 466 and 467:
Executive Summary in most areas, to
- Page 468 and 469:
Executive Summary growth scenarios.
- Page 470 and 471:
Executive Summary Following the cre
- Page 472 and 473:
2 of 2 Issues identified in the Sna
- Page 475 and 476:
WIND/BIGHORN RIVER BASIN PLAN EXECU
- Page 477:
EXECUTIVE SUMMARY Authorization The
- Page 480 and 481:
acres of state land and 8.9 million
- Page 483 and 484:
Municipal and Domestic According to
- Page 485 and 486:
Table 2 presents a summary of the s
- Page 488 and 489:
Ground Water Availability Within th
- Page 490 and 491:
Figure 5 Potential Areas for Future
- Page 492 and 493:
Power Study The Wind/Bighorn River
- Page 495:
Appendix B WESTERN STATES SURVEY
- Page 498 and 499:
GENERAL POINTS AND SUGGESTED IDEAS
- Page 500 and 501:
Texas 1. Texas has been involved in
- Page 502 and 503:
state agency. Place value on citize
- Page 505:
Appendix C FUTURE BASIN PLAN ORDER
- Page 508 and 509:
Green River Basin Population 100000
- Page 511:
Appendix D PUBLIC COMMENTS
- Page 515 and 516:
D-2
- Page 517 and 518:
D-4
- Page 519 and 520:
D-6
- Page 521 and 522:
D-8
- Page 523 and 524:
D-10