THE BUS AND COACH MARKET THE MARKET FOR INDUSTRIAL AND MARINE ENGINES <strong>Scania</strong>’s ten largest bus markets, vehicles delivered to customers Deliveries of <strong>Scania</strong> buses in western Europe <strong>Scania</strong>’s ten largest markets for industrial and marine engines delivered to customers Deliveries of <strong>Scania</strong> engines in western Europe Change Rank Country <strong>2004</strong> 2003 in % Units 3,000 Change Rank Country <strong>2004</strong> 2003 in % Units 3,000 1 (1) Brazil 623 505 23 2 (2) Spain 592 479 24 3 (3) Great Britain 444 473 – 6 4 (6) Mexico 381 287 33 5 (4) Italy 325 399 – 19 6 (14) Iran 300 104 189 7 (11) Russia 270 149 81 8 (7) Taiwan 256 223 15 9 (9) Australia 205 187 10 10 (29) Malaysia 160 41 290 <strong>Scania</strong>’s total deliveries to customers reached more than 5,500 units during <strong>2004</strong>, an increase of twelve percent compared to 2003. 2,500 2,000 1,500 1,000 500 0 95 96 97 98 99 00 01 02 03 04 1 (1) Brazil 1,392 614 127 2 (4) Spain 734 264 178 3 (2) Sweden 505 500 1 4 (3) Great Britain 355 278 28 5 (6) The Netherlands 313 196 60 6 (11) Singapore 272 88 209 7 (13) Norway 217 81 168 8 (7) Argentina 211 145 46 9 (5) Italy 202 200 1 10 (14) Finland 174 61 185 Total <strong>Scania</strong> deliveries to customers reached more than 5,000 units, an increase of 58 percent compared to 2003. 2,500 2,000 1,500 1,000 500 0 95 96 97 98 99 00 01 02 03 04 Registrations of buses above 12 tonnes Units <strong>2004</strong> 2003 2002 Deliveries of <strong>Scania</strong> buses in South America Deliveries of <strong>Scania</strong> engines in South America WESTERN EUROPE Total 22,380 21,735 22,522 of which <strong>Scania</strong> 2,160 2,062 1,643 Units 3,000 Units 3,000 Spain 2,603 2,383 2,247 of which <strong>Scania</strong> 569 458 394 Great Britain 3,137 3,268 2,600 of which <strong>Scania</strong> 473 459 188 Italy 3,247 2,558 2,969 of which <strong>Scania</strong> 339 310 347 Finland 257 268 269 of which <strong>Scania</strong> 122 158 159 Sweden 913 884 896 of which <strong>Scania</strong> 69 199 153 2,500 2,000 1,500 1,000 500 0 95 96 97 98 99 00 01 02 03 04 2,500 2,000 1,500 1,000 500 0 95 96 97 98 99 00 01 02 03 04 FACTS ABOUT SCANIA • SCANIA ANNUAL REPORT <strong>2004</strong> 42
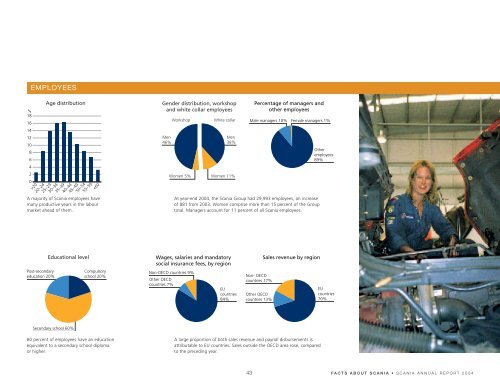
EMPLOYEES % 18 16 14 12 10 8 6 4 2 0 >20 20–24 Age distribution 25–29 30–34 35–39 40–44 45–49 50–54 55–59