

Scania annual report 2004
Scania annual report 2004
Scania annual report 2004

You also want an ePaper? Increase the reach of your titles
YUMPU automatically turns print PDFs into web optimized ePapers that Google loves.
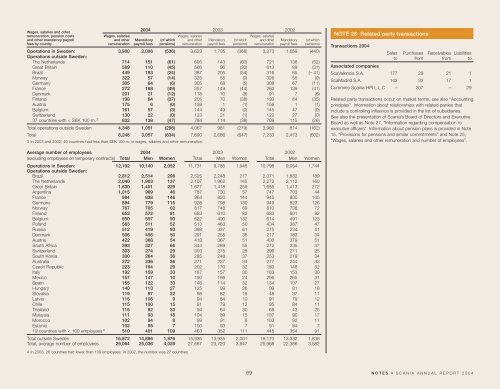
Wages, salaries and other<br />
<strong>2004</strong> 2003 2002<br />
remuneration, pension costs Wages, salaries Wages, salaries Wages, salaries<br />
and other mandatory payroll and other Mandatory (of which and other Mandatory (of which and other Mandatory (of which<br />
fees by country remuneration payroll fees pensions) remuneration payroll fees pensions) remuneration payroll fees pensions)<br />
Operations in Sweden: 3,900 2,006 (536) 3,623 1,705 (368) 3,273 1,659 (440)<br />
Operations outside Sweden:<br />
The Netherlands 714 151 (61) 695 143 (60) 721 138 (52)<br />
Great Britain 589 110 (45) 566 96 (30) 613 89 (31)<br />
Brazil 449 193 (24) 387 205 (54) 316 65 (– 41)<br />
Norway 322 57 (14) 325 55 (0) 326 55 (0)<br />
Germany 305 64 (6) 305 68 (5) 308 67 (11)<br />
France 272 168 (49) 257 149 (44) 260 139 (41)<br />
Denmark 201 21 (12) 118 10 (8) 91 7 (6)<br />
Finland 198 64 (37) 205 70 (38) 193 64 (35)<br />
Austria 175 6 (0) 158 1 (1) 156 1 (1)<br />
Belgium 161 57 (3) 144 49 (0) 145 47 (0)<br />
Switzerland 130 22 (0) 123 21 (1) 122 27 (0)<br />
37 countries with < SEK 100 m. 3 832 138 (47) 784 114 (38) 709 115 (26)<br />
Total operations outside Sweden 4,348 1,051 (298) 4,067 981 (279) 3,960 814 (162)<br />
Total 8,248 3,057 (834) 7,690 2,686 (647) 7,233 2,473 (602)<br />
3 In 2003 and 2002, 40 countries had less than SEK 100 m. in wages, salaries and other remuneration.<br />
NOTE 26 Related party transactions<br />
Transactions <strong>2004</strong><br />
Sales Purchases Receivables Liabilities<br />
to from from to<br />
Associated companies<br />
ScaValencia S.A. 177 29 21 1<br />
ScaMadrid S.A. 143 33 17 1<br />
Cummins-<strong>Scania</strong> HPI L.L.C – 207 – 29<br />
Related party transactions occur on market terms, see also “Accounting<br />
principles”. Information about relationships with related parties that<br />
include a controlling influence is provided in the list of subsidiaries.<br />
See also the presentation of <strong>Scania</strong>’s Board of Directors and Executive<br />
Board as well as Note 27, “Information regarding compensation to<br />
executive officers”. Information about pension plans is provided in Note<br />
15, “Provisions for pensions and similar commitments” and Note 25,<br />
“Wages, salaries and other remuneration and number of employees”.<br />
Average number of employees <strong>2004</strong> 2003 2002<br />
(excluding employees on temporary contracts) Total Men Women Total Men Women Total Men Women<br />
Operations in Sweden: 12,192 10,140 2,052 11,731 9,785 1,946 10,798 9,054 1,744<br />
Operations outside Sweden:<br />
Brazil 2,812 2,514 298 2,525 2,248 277 2,071 1,882 189<br />
The Netherlands 2,040 1,903 137 2,107 1,962 145 2,272 2,112 160<br />
Great Britain 1,630 1,401 229 1,677 1,418 259 1,685 1,413 272<br />
Argentina 1,015 969 46 787 730 57 747 703 44<br />
France 984 838 146 964 820 144 945 800 145<br />
Germany 894 779 115 928 798 130 949 823 126<br />
Norway 767 705 62 817 748 69 810 738 72<br />
Finland 653 572 81 693 610 83 683 601 82<br />
Belgium 650 557 93 622 490 132 614 491 123<br />
Poland 563 511 52 513 463 50 434 387 47<br />
Russia 512 419 93 398 337 61 275 234 41<br />
Denmark 506 456 50 291 255 36 217 183 34<br />
Austria 422 368 54 418 367 51 430 379 51<br />
South Africa 393 327 66 344 289 55 272 235 37<br />
Switzerland 303 274 29 303 275 28 296 271 25<br />
South Korea 300 264 36 285 248 37 253 219 34<br />
Australia 272 236 36 271 237 34 277 244 33<br />
Czech Republic 223 194 29 202 170 32 180 148 32<br />
Italy 192 159 33 187 157 30 183 153 30<br />
Mexico 157 147 10 190 166 24 296 265 31<br />
Spain 155 122 33 146 114 32 134 107 27<br />
Hungary 140 113 27 125 99 26 99 81 18<br />
Slovakia 119 97 22 98 82 16 48 37 11<br />
Latvia 115 106 9 94 84 10 91 79 12<br />
Chile 115 100 15 91 79 12 95 84 11<br />
Thailand 115 82 33 94 64 30 68 43 25<br />
Malaysia 111 93 18 104 89 15 107 90 17<br />
Morocco 102 94 8 99 91 8 103 92 11<br />
Estonia 102 95 7 100 93 7 91 84 7<br />
19 countries with < 100 employees 4 510 401 109 463 352 111 445 354 91<br />
Total outside Sweden 16,872 14,896 1,976 15,936 13,935 2,001 15,170 13,332 1,838<br />
Total, average number of employees 29,064 25,036 4,028 27,667 23,720 3,947 25,968 22,386 3,582<br />
4 In 2003, 26 countries had fewer than 100 employees. In 2002, the number was 27 countries.<br />
69 NOTES • SCANIA ANNUAL REPORT <strong>2004</strong>


