

Scania annual report 2004
Scania annual report 2004
Scania annual report 2004

You also want an ePaper? Increase the reach of your titles
YUMPU automatically turns print PDFs into web optimized ePapers that Google loves.
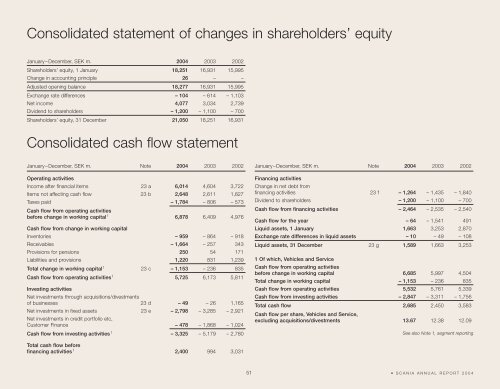
Consolidated statement of changes in shareholders’ equity<br />
January–December, SEK m. <strong>2004</strong> 2003 2002<br />
Shareholders’ equity, 1 January 18,251 16,931 15,995<br />
Change in accounting principle 26 – –<br />
Adjusted opening balance 18,277 16,931 15,995<br />
Exchange rate differences – 104 – 614 – 1,103<br />
Net income 4,077 3,034 2,739<br />
Dividend to shareholders – 1,200 – 1,100 – 700<br />
Shareholders’ equity, 31 December 21,050 18,251 16,931<br />
Consolidated cash flow statement<br />
January–December, SEK m. Note <strong>2004</strong> 2003 2002<br />
Operating activities<br />
Income after financial items 23 a 6,014 4,604 3,722<br />
Items not affecting cash flow 23 b 2,648 2,611 1,827<br />
Taxes paid – 1,784 – 806 – 573<br />
Cash flow from operating activities<br />
before change in working capital 1 6,878 6,409 4,976<br />
Cash flow from change in working capital<br />
Inventories – 959 – 864 – 918<br />
Receivables – 1,664 – 257 343<br />
Provisions for pensions 250 54 171<br />
Liabilities and provisions 1,220 831 1,239<br />
Total change in working capital 1 23 c – 1,153 – 236 835<br />
Cash flow from operating activities 1 5,725 6,173 5,811<br />
Investing activities<br />
Net investments through acquisitions/divestments<br />
of businesses 23 d – 49 – 26 1,165<br />
Net investments in fixed assets 23 e – 2,798 – 3,285 – 2,921<br />
Net investments in credit portfolio etc,<br />
Customer Finance – 478 – 1,868 – 1,024<br />
Cash flow from investing activities 1 – 3,325 – 5,179 – 2,780<br />
January–December, SEK m. Note <strong>2004</strong> 2003 2002<br />
Financing activities<br />
Change in net debt from<br />
financing activities 23 f – 1,264 – 1,435 – 1,840<br />
Dividend to shareholders – 1,200 – 1,100 – 700<br />
Cash flow from financing activities – 2,464 – 2,535 – 2,540<br />
Cash flow for the year – 64 – 1,541 491<br />
Liquid assets, 1 January 1,663 3,253 2,870<br />
Exchange rate differences in liquid assets – 10 – 49 – 108<br />
Liquid assets, 31 December 23 g 1,589 1,663 3,253<br />
1 Of which, Vehicles and Service<br />
Cash flow from operating activities<br />
before change in working capital 6,685 5,997 4,504<br />
Total change in working capital – 1,153 – 236 835<br />
Cash flow from operating activities 5,532 5,761 5,339<br />
Cash flow from investing activities – 2,847 – 3,311 – 1,756<br />
Total cash flow 2,685 2,450 3,583<br />
Cash flow per share, Vehicles and Service,<br />
excluding acquisitions/divestments 13.67 12.38 12.09<br />
See also Note 1, segment <strong>report</strong>ing<br />
Total cash flow before<br />
financing activities 1 2,400 994 3,031<br />
51 • SCANIA ANNUAL REPORT <strong>2004</strong>


