Ecological Transport Information Tool for Worldwide ... - Schenker
Ecological Transport Information Tool for Worldwide ... - Schenker
Ecological Transport Information Tool for Worldwide ... - Schenker

Create successful ePaper yourself
Turn your PDF publications into a flip-book with our unique Google optimized e-Paper software.
Page 56<br />
IFEU Heidelberg, Öko-Institut, IVE, RMCON<br />
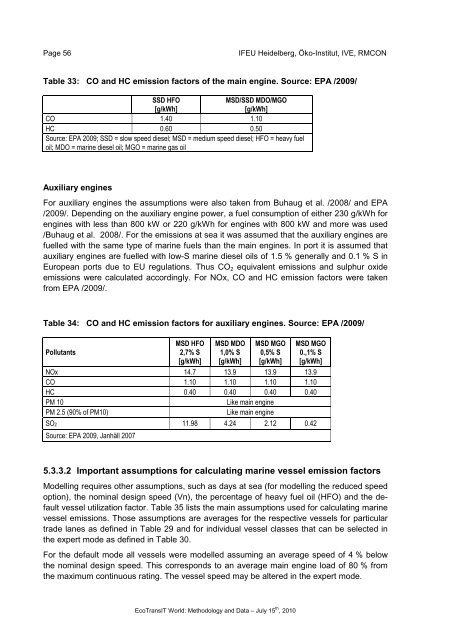
Table 33: CO and HC emission factors of the main engine. Source: EPA /2009/<br />
SSD HFO<br />
[g/kWh]<br />
MSD/SSD MDO/MGO<br />
[g/kWh]<br />
CO 1.40 1.10<br />
HC 0.60 0.50<br />
Source: EPA 2009; SSD = slow speed diesel; MSD = medium speed diesel; HFO = heavy fuel<br />
oil; MDO = marine diesel oil; MGO = marine gas oil<br />
Auxiliary engines<br />
For auxiliary engines the assumptions were also taken from Buhaug et al. /2008/ and EPA<br />
/2009/. Depending on the auxiliary engine power, a fuel consumption of either 230 g/kWh <strong>for</strong><br />
engines with less than 800 kW or 220 g/kWh <strong>for</strong> engines with 800 kW and more was used<br />
/Buhaug et al. 2008/. For the emissions at sea it was assumed that the auxiliary engines are<br />
fuelled with the same type of marine fuels than the main engines. In port it is assumed that<br />
auxiliary engines are fuelled with low-S marine diesel oils of 1.5 % generally and 0.1 % S in<br />
European ports due to EU regulations. Thus CO 2 equivalent emissions and sulphur oxide<br />
emissions were calculated accordingly. For NOx, CO and HC emission factors were taken<br />
from EPA /2009/.<br />
Table 34: CO and HC emission factors <strong>for</strong> auxiliary engines. Source: EPA /2009/<br />
Pollutants<br />
MSD HFO<br />
2,7% S<br />
[g/kWh]<br />
MSD MDO<br />
1,0% S<br />
[g/kWh]<br />
MSD MGO<br />
0,5% S<br />
[g/kWh]<br />
MSD MGO<br />
0.,1% S<br />
[g/kWh]<br />
NOx 14.7 13.9 13.9 13.9<br />
CO 1.10 1.10 1.10 1.10<br />
HC 0.40 0.40 0.40 0.40<br />
PM 10<br />
Like main engine<br />
PM 2.5 (90% of PM10)<br />
Like main engine<br />
SO2 11.98 4.24 2.12 0.42<br />
Source: EPA 2009, Janhäll 2007<br />
5.3.3.2 Important assumptions <strong>for</strong> calculating marine vessel emission factors<br />
Modelling requires other assumptions, such as days at sea (<strong>for</strong> modelling the reduced speed<br />
option), the nominal design speed (Vn), the percentage of heavy fuel oil (HFO) and the default<br />
vessel utilization factor. Table 35 lists the main assumptions used <strong>for</strong> calculating marine<br />
vessel emissions. Those assumptions are averages <strong>for</strong> the respective vessels <strong>for</strong> particular<br />
trade lanes as defined in Table 29 and <strong>for</strong> individual vessel classes that can be selected in<br />
the expert mode as defined in Table 30.<br />
For the default mode all vessels were modelled assuming an average speed of 4 % below<br />
the nominal design speed. This corresponds to an average main engine load of 80 % from<br />
the maximum continuous rating. The vessel speed may be altered in the expert mode.<br />
EcoTransIT World: Methodology and Data – July 15 th , 2010