3100B HFOV Operator Manual - CareFusion
3100B HFOV Operator Manual - CareFusion
3100B HFOV Operator Manual - CareFusion

You also want an ePaper? Increase the reach of your titles
YUMPU automatically turns print PDFs into web optimized ePapers that Google loves.
14 <strong>3100B</strong> <strong>HFOV</strong><br />
Results<br />
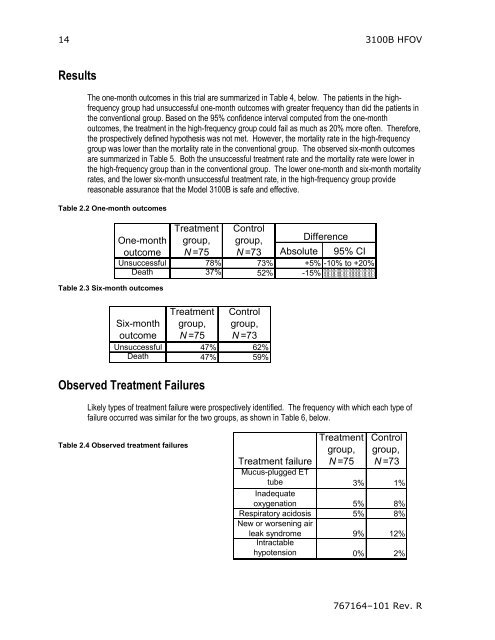
The one-month outcomes in this trial are summarized in Table 4, below. The patients in the highfrequency<br />
group had unsuccessful one-month outcomes with greater frequency than did the patients in<br />
the conventional group. Based on the 95% confidence interval computed from the one-month<br />
outcomes, the treatment in the high-frequency group could fail as much as 20% more often. Therefore,<br />
the prospectively defined hypothesis was not met. However, the mortality rate in the high-frequency<br />
group was lower than the mortality rate in the conventional group. The observed six-month outcomes<br />
are summarized in Table 5. Both the unsuccessful treatment rate and the mortality rate were lower in<br />
the high-frequency group than in the conventional group. The lower one-month and six-month mortality<br />
rates, and the lower six-month unsuccessful treatment rate, in the high-frequency group provide<br />
reasonable assurance that the Model <strong>3100B</strong> is safe and effective.<br />
Table 2.2 One-month outcomes<br />
One-month<br />
outcome<br />
Table 2.3 Six-month outcomes<br />
Treatment<br />
group,<br />
N =75<br />
Control<br />
group,<br />
N =73<br />
Difference<br />
Absolute 95% CI<br />
Unsuccessful 78% 73% +5% -10% to +20%<br />
Death 37% 52% -15%<br />
Six-month<br />
outcome<br />
Treatment<br />
group,<br />
N =75<br />
Observed Treatment Failures<br />
Control<br />
group,<br />
N =73<br />
Unsuccessful 47% 62%<br />
Death 47% 59%<br />
Likely types of treatment failure were prospectively identified. The frequency with which each type of<br />
failure occurred was similar for the two groups, as shown in Table 6, below.<br />
Table 2.4 Observed treatment failures<br />
Treatment failure<br />
Treatment<br />
group,<br />
N =75<br />
Control<br />
group,<br />
N =73<br />
Mucus-plugged ET<br />
tube 3% 1%<br />
Inadequate<br />
oxygenation 5% 8%<br />
Respiratory acidosis 5% 8%<br />
New or worsening air<br />
leak syndrome 9% 12%<br />
Intractable<br />
hypotension 0% 2%<br />
767164–101 Rev. R