MADISON METROPOliTAN SCHOOl DISTRICT - School Information ...
MADISON METROPOliTAN SCHOOl DISTRICT - School Information ...
MADISON METROPOliTAN SCHOOl DISTRICT - School Information ...

You also want an ePaper? Increase the reach of your titles
YUMPU automatically turns print PDFs into web optimized ePapers that Google loves.
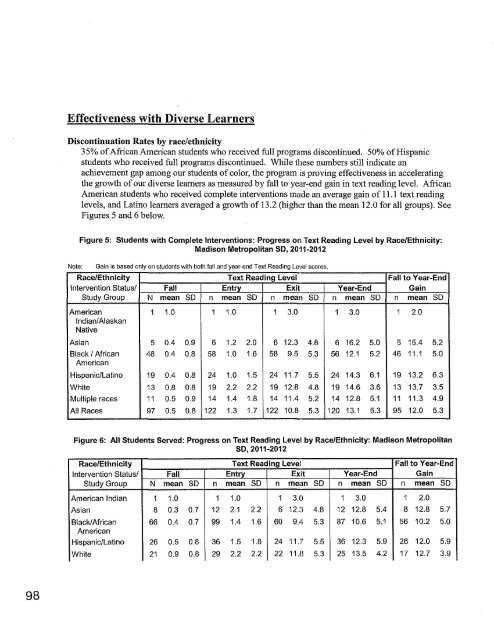
Effectiveness with Diverse Learners<br />
Discontinuation Rates by race/ethnicity<br />
35% of African American students who received full programs discontinued. 50% of Hispanic<br />
students who received full programs discontinued. While these numbers still indicate an<br />
achievement gap among our students of color, the program is proving effectiveness in accelerating<br />
the growth of our diverse learners as measured by fall to year-end gain in text reading level. African<br />
American students who received complete interventions made an average gain of 11.1 text reading<br />
levels, and Latino learners averaged a growth of 13.2 (higher than the mean 12.0 for all groups). See<br />
Figures 5 and 6 below.<br />
Note:<br />
Figure 5: Students with Complete Interventions: Progress on Text Reading Level by Race/Ethnicity:<br />
Madison Metropolitan SO, 2011-2012<br />
Gain is based only on students with both fall and year~end Text Reading Level scores.<br />
Race/Ethnicity Text Reading Level Fall to Year-End<br />
Intervention Status/ Fall Entry Exit Year-End Gain<br />
Study Group N mean SD n mean SD n mean SD n mean SD n mean SD<br />
American 1 1.0 1 1.0 1 3.0 1 3.0 1 2.0<br />
Indian/Alaskan<br />
Native<br />
Asian 5 0.4 0.9 6 1.2 2.0 6 12.3 4.8 6 16.2 5.0 5 15.4 5.2<br />
Black I African 48 0.4 0.8 58 1.0 1.6 58 9.5 5.3 56 12.1 5.2 46 11.1 5.0<br />
American<br />
Hispanic/Latino 19 0.4 0.8 24 1.0 1.5 24 11.7 5.5 24 14.3 6.1 19 13.2 6.3<br />
White 13 0.8 0.8 19 2.2 2.2 19 12.8 4.8 19 14.6 3.6 13 13.7 3.5<br />
Multiple races 11 0.5 0.9 14 1.4 1.8 14 11.4 5.2 14 12.8 5.1 11 11.3 4.9<br />
All Races 97 0.5 0.8 122 1.3 1.7 122 10.8 5.3 120 13.1 5.3 95 12.0 5.3<br />
Figure 6: All Students Served: Progress on Text Reading Level by Race/Ethnicity: Madison Metropolitan<br />
so, 2011-2012<br />
Race/Ethnicity Text Reading Level Fall to Year-End<br />
Intervention Status/ Fall. Entry Exit Year-End Gain<br />
Study Group N mean SD n mean so n mean SD n mean SD n mean SD<br />
American Indian 1 1.0 1 1.0 1 3.0 1 3.0 1 2.0<br />
Asian 8 0.3 0.7 12 2.1 2.2 6 12.:\ 4.8 12 12.8 5.4 8 12.8 5.7<br />
Black/African 66 0.4 0.7 99 1.4 1.6 60 9.4 5.3 87 10.6 5.1 56 10.2 5.0<br />
American<br />
Hispanic/Latino 26 0.5 0.8 36 1.5 1.8 24 11.7 5.5 36 12.3 5.9 26 12.0 5.9<br />
White 21 0.9 0.8 29 2.2 2.2 22 11.8 5.3 25 13.5 4.2 17 12.7 3.9<br />
98


![by Shaina Wright [PDF] Ralph Waldo Emerson Prize 2006 - School ...](https://img.yumpu.com/26083584/1/174x260/by-shaina-wright-pdf-ralph-waldo-emerson-prize-2006-school-.jpg?quality=85)