MADISON METROPOliTAN SCHOOl DISTRICT - School Information ...
MADISON METROPOliTAN SCHOOl DISTRICT - School Information ...
MADISON METROPOliTAN SCHOOl DISTRICT - School Information ...

You also want an ePaper? Increase the reach of your titles
YUMPU automatically turns print PDFs into web optimized ePapers that Google loves.
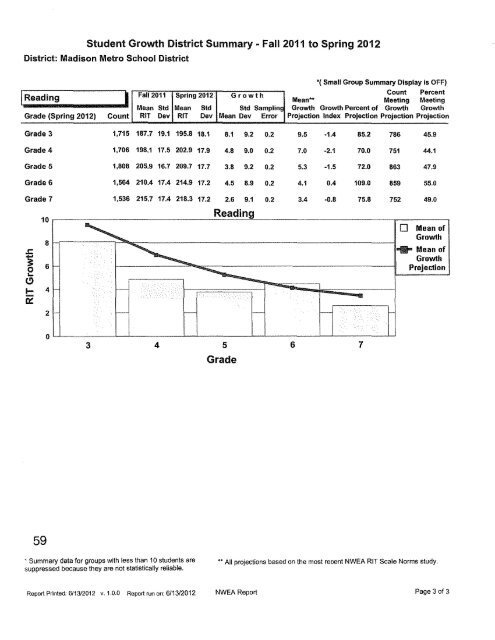
Student Growth District Summary- Fall2011 to Spring 2012<br />
District: Madison Metro <strong>School</strong> District<br />
•( Small Group Summary Display is OFF)<br />
!Reading I Fall2011 Spring 2012 Growth Count Percent<br />
Mean** Meeting Meeting<br />
Mean Std Mean Std Std Samplin! Growth Growth Percent of Growth Growth<br />
Grade (Spring 2012) Count RIT Dev RIT Dev Mean Dev Error Projection Index Projection Projection Projection<br />
Grade 3 1,715 187.7 19.1 195.8<br />
Grade 4 1,706 198.1 17.5 202.9<br />
Grade 5 1,808 205.9 16.7 209.7<br />
Grade 6 1,564 210.4 17.4 214.9<br />
Grade 7 1,536 215.7 17.4 218.3<br />
10<br />
8<br />
J:<br />
~<br />
6<br />
~<br />
~<br />
....<br />
C) r-··<br />
1- 4 r-<br />
C2<br />
2 r-- -<br />
18.1 8.1 9.2 0.2 9.5 -1.4 85.2 786 45.9<br />
17.9 4.8 9.0 0.2 7.0 -2.1 70.0 751 44.1<br />
17.7 3.8 9.2 0.2 5.3 -1.5 72.0 863 47.9<br />
17.2 4.5 8.9 0.2 4.1 0.4 109.0 859 55.0<br />
17.2 2.6 9.1 0.2 3.4 -0.8 75.8 752 49.0<br />
.............<br />
Reading<br />
---·<br />
-<br />
-·--<br />
D Mean of<br />
I+<br />
I Growth<br />
-·----- ---l<br />
Mean of<br />
Growth<br />
Projection<br />
- --<br />
1--<br />
~<br />
--<br />
I<br />
0<br />
3 4<br />
5<br />
Grade<br />
6<br />
7<br />
59<br />
• Summary data for groups with less than 10 students are<br />
suppressed because they are not statistically reliable.<br />
**All projections based on the most recent NWEA RIT Scale Norms study.<br />
Report Printed: 6/13/2012 v. 1 .0.0 Report run on: 6/13/2012<br />
NWEA Report Page 3 of 3


![by Shaina Wright [PDF] Ralph Waldo Emerson Prize 2006 - School ...](https://img.yumpu.com/26083584/1/174x260/by-shaina-wright-pdf-ralph-waldo-emerson-prize-2006-school-.jpg?quality=85)