

CRC Report No. A-34 - Coordinating Research Council
CRC Report No. A-34 - Coordinating Research Council
CRC Report No. A-34 - Coordinating Research Council

You also want an ePaper? Increase the reach of your titles
YUMPU automatically turns print PDFs into web optimized ePapers that Google loves.
April 2005<br />
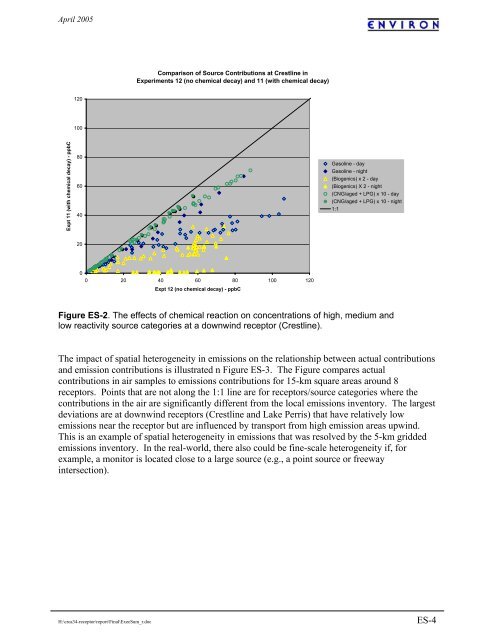
Comparison of Source Contributions at Crestline in<br />
Experiments 12 (no chemical decay) and 11 (with chemical decay)<br />
120<br />
100<br />
Expt 11 (with chemical decay) - ppbC<br />
80<br />
60<br />
40<br />
Gasoline - day<br />
Gasoline - night<br />
(Biogenics) x 2 - day<br />
(Biogenics) X 2 - night<br />
(CNG/aged + LPG) x 10 - day<br />
(CNG/aged + LPG) x 10 - night<br />
1:1<br />
20<br />
0<br />
0 20 40 60 80 100 120<br />
Expt 12 (no chemical decay) - ppbC<br />
Figure ES-2. The effects of chemical reaction on concentrations of high, medium and<br />
low reactivity source categories at a downwind receptor (Crestline).<br />
The impact of spatial heterogeneity in emissions on the relationship between actual contributions<br />
and emission contributions is illustrated n Figure ES-3. The Figure compares actual<br />
contributions in air samples to emissions contributions for 15-km square areas around 8<br />
receptors. Points that are not along the 1:1 line are for receptors/source categories where the<br />
contributions in the air are significantly different from the local emissions inventory. The largest<br />
deviations are at downwind receptors (Crestline and Lake Perris) that have relatively low<br />
emissions near the receptor but are influenced by transport from high emission areas upwind.<br />
This is an example of spatial heterogeneity in emissions that was resolved by the 5-km gridded<br />
emissions inventory. In the real-world, there also could be fine-scale heterogeneity if, for<br />
example, a monitor is located close to a large source (e.g., a point source or freeway<br />
intersection).<br />
H:\crca<strong>34</strong>-receptor\report\Final\ExecSum_r.doc<br />
ES-4


