

CRC Report No. A-34 - Coordinating Research Council
CRC Report No. A-34 - Coordinating Research Council
CRC Report No. A-34 - Coordinating Research Council

Create successful ePaper yourself
Turn your PDF publications into a flip-book with our unique Google optimized e-Paper software.
April 2005<br />
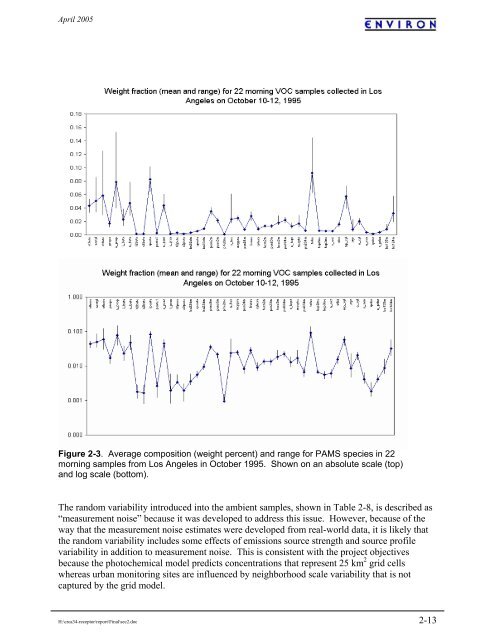
Figure 2-3. Average composition (weight percent) and range for PAMS species in 22<br />
morning samples from Los Angeles in October 1995. Shown on an absolute scale (top)<br />
and log scale (bottom).<br />
The random variability introduced into the ambient samples, shown in Table 2-8, is described as<br />
“measurement noise” because it was developed to address this issue. However, because of the<br />
way that the measurement noise estimates were developed from real-world data, it is likely that<br />
the random variability includes some effects of emissions source strength and source profile<br />
variability in addition to measurement noise. This is consistent with the project objectives<br />
because the photochemical model predicts concentrations that represent 25 km 2 grid cells<br />
whereas urban monitoring sites are influenced by neighborhood scale variability that is not<br />
captured by the grid model.<br />
H:\crca<strong>34</strong>-receptor\report\Final\sec2.doc 2-13


