

CRC Report No. A-34 - Coordinating Research Council
CRC Report No. A-34 - Coordinating Research Council
CRC Report No. A-34 - Coordinating Research Council

Create successful ePaper yourself
Turn your PDF publications into a flip-book with our unique Google optimized e-Paper software.
April 2005<br />
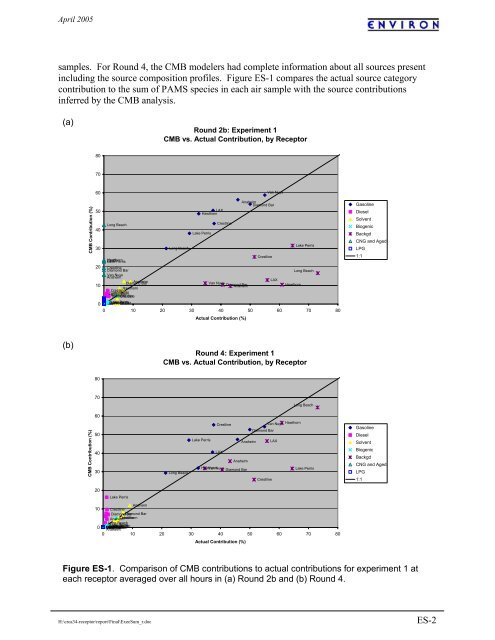
samples. For Round 4, the CMB modelers had complete information about all sources present<br />
including the source composition profiles. Figure ES-1 compares the actual source category<br />
contribution to the sum of PAMS species in each air sample with the source contributions<br />
inferred by the CMB analysis.<br />
(a)<br />
Round 2b: Experiment 1<br />
CMB vs. Actual Contribution, by Receptor<br />
80<br />
70<br />
60<br />
Van Nuys<br />
CMB Contribution (%)<br />
Anaheim<br />
Diamond Bar<br />
50<br />
LAX<br />
Hawthorn<br />
Long Beach<br />
Crestline<br />
40<br />
Lake Perris<br />
30<br />
Long Beach<br />
Lake Perris<br />
Crestline<br />
23.23 Hawthorn<br />
Lake Perris<br />
20 Crestline<br />
Diamond Bar<br />
Long Beach<br />
10<br />
Van Nuys<br />
Anaheim<br />
Diamond<br />
Anaheim<br />
LAX<br />
Bar<br />
Van Nuys<br />
Diamond Anaheim Bar<br />
Hawthorn<br />
Crestline<br />
Long Lake Beach Perris<br />
Anaheim Diamond Crestline Bar<br />
Hawthorn<br />
0 Anaheim Diamond Lake Van Perris Nuys Bar<br />
0 10 20 30 40 50 60 70 80<br />
Actual Contribution (%)<br />
Gasoline<br />
Diesel<br />
Solvent<br />
Biogenic<br />
Backgd<br />
CNG and Aged<br />
LPG<br />
1:1<br />
(b)<br />
Round 4: Experiment 1<br />
CMB vs. Actual Contribution, by Receptor<br />
80<br />
70<br />
Long Beach<br />
60<br />
CMB Contribution (%)<br />
50<br />
40<br />
30<br />
Long Beach<br />
Crestline<br />
Van Nuys Hawthorn<br />
Diamond Bar<br />
Lake Perris<br />
Anaheim LAX<br />
LAX<br />
Anaheim<br />
Hawthorn Van Nuys Diamond Bar<br />
Lake Perris<br />
Crestline<br />
Gasoline<br />
Diesel<br />
Solvent<br />
Biogenic<br />
Backgd<br />
CNG and Aged<br />
LPG<br />
1:1<br />
20<br />
Lake Perris<br />
Anaheim<br />
10 Crestline<br />
Diamond Diamond Bar Bar<br />
Anaheim Crestline Hawthorn<br />
0<br />
Long Beach<br />
0.00 Anaheim Diamond Lake Van Perris<br />
Diamond Van Hawthorn Crestline Lake Long Nuys Perris Beach<br />
Nuys<br />
Bar Bar<br />
Anaheim<br />
0 10 20 30 40 50 60 70 80<br />
Actual Contribution (%)<br />
Figure ES-1. Comparison of CMB contributions to actual contributions for experiment 1 at<br />
each receptor averaged over all hours in (a) Round 2b and (b) Round 4.<br />
H:\crca<strong>34</strong>-receptor\report\Final\ExecSum_r.doc<br />
ES-2


