

CRC Report No. A-34 - Coordinating Research Council
CRC Report No. A-34 - Coordinating Research Council
CRC Report No. A-34 - Coordinating Research Council

You also want an ePaper? Increase the reach of your titles
YUMPU automatically turns print PDFs into web optimized ePapers that Google loves.
April 2005<br />
<strong>CRC</strong> project A-42-2 (ENVIRON, 2002a). In RTRAC, an arbitrary number of additional tracer<br />
species can be added to a CAMx simulation where they are emitted, transported and deposited<br />
using the core model algorithms. The core model chemistry drives the chemical decay of<br />
RTRAC tracers by reactions with OH radical, NO 3 radical, ozone and photolysis. Compared to<br />
the alternate approach of adding “live species” to the core model the RTRAC approach has<br />
several advantages for this study:<br />
• Reactive tracers are much more computationally efficient than live species.<br />
• The oxidant fields are decoupled from uncertainties in the chemistry of the tracers.<br />
• The source strengths of the tracers may be varied without changing the oxidant fields<br />
allowing experiments to be more controlled.<br />
RTRAC was used to model atmospheric concentrations of 55 PAMS species from 22 source<br />
categories giving a total of 1210 unique tracers in each simulation. The total concentration of a<br />
PAMS species at a receptor location is the sum of tracers for that species over the 22 source<br />
categories modeled, plus a background. Sampling noise was added to this total concentration as<br />
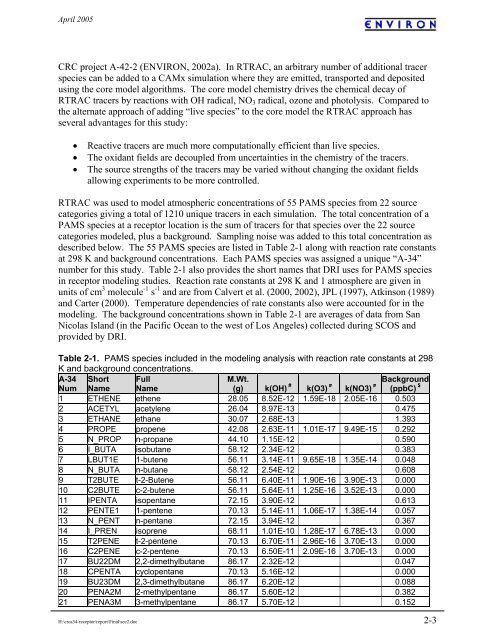
described below. The 55 PAMS species are listed in Table 2-1 along with reaction rate constants<br />
at 298 K and background concentrations. Each PAMS species was assigned a unique “A-<strong>34</strong>”<br />
number for this study. Table 2-1 also provides the short names that DRI uses for PAMS species<br />
in receptor modeling studies. Reaction rate constants at 298 K and 1 atmosphere are given in<br />
units of cm 3 molecule -1 s -1 and are from Calvert et al. (2000, 2002), JPL (1997), Atkinson (1989)<br />
and Carter (2000). Temperature dependencies of rate constants also were accounted for in the<br />
modeling. The background concentrations shown in Table 2-1 are averages of data from San<br />
Nicolas Island (in the Pacific Ocean to the west of Los Angeles) collected during SCOS and<br />
provided by DRI.<br />
Table 2-1. PAMS species included in the modeling analysis with reaction rate constants at 298<br />
K and background concentrations.<br />
A-<strong>34</strong><br />
Num<br />
Short<br />
Name<br />
Full<br />
Name<br />
M.Wt.<br />
(g) k(OH) # k(O3) # k(NO3) # Background<br />
(ppbC) $<br />
1 ETHENE ethene 28.05 8.52E-12 1.59E-18 2.05E-16 0.503<br />
2 ACETYL acetylene 26.04 8.97E-13 0.475<br />
3 ETHANE ethane 30.07 2.68E-13 1.393<br />
4 PROPE propene 42.08 2.63E-11 1.01E-17 9.49E-15 0.292<br />
5 N_PROP n-propane 44.10 1.15E-12 0.590<br />
6 I_BUTA isobutane 58.12 2.<strong>34</strong>E-12 0.383<br />
7 LBUT1E 1-butene 56.11 3.14E-11 9.65E-18 1.35E-14 0.048<br />
8 N_BUTA n-butane 58.12 2.54E-12 0.608<br />
9 T2BUTE t-2-Butene 56.11 6.40E-11 1.90E-16 3.90E-13 0.000<br />
10 C2BUTE c-2-butene 56.11 5.64E-11 1.25E-16 3.52E-13 0.000<br />
11 IPENTA isopentane 72.15 3.90E-12 0.613<br />
12 PENTE1 1-pentene 70.13 5.14E-11 1.06E-17 1.38E-14 0.057<br />
13 N_PENT n-pentane 72.15 3.94E-12 0.367<br />
14 I_PREN isoprene 68.11 1.01E-10 1.28E-17 6.78E-13 0.000<br />
15 T2PENE t-2-pentene 70.13 6.70E-11 2.96E-16 3.70E-13 0.000<br />
16 C2PENE c-2-pentene 70.13 6.50E-11 2.09E-16 3.70E-13 0.000<br />
17 BU22DM 2,2-dimethylbutane 86.17 2.32E-12 0.047<br />
18 CPENTA cyclopentane 70.13 5.16E-12 0.000<br />
19 BU23DM 2,3-dimethylbutane 86.17 6.20E-12 0.088<br />
20 PENA2M 2-methylpentane 86.17 5.60E-12 0.382<br />
21 PENA3M 3-methylpentane 86.17 5.70E-12 0.152<br />
H:\crca<strong>34</strong>-receptor\report\Final\sec2.doc 2-3


