

CRC Report No. A-34 - Coordinating Research Council
CRC Report No. A-34 - Coordinating Research Council
CRC Report No. A-34 - Coordinating Research Council

You also want an ePaper? Increase the reach of your titles
YUMPU automatically turns print PDFs into web optimized ePapers that Google loves.
April 2005<br />
appear to originate from source profiles approaching co-linearity due to exclusion of nonane,<br />
decane and undecane from the fit for “aged” samples.<br />
Several of the source categories accurately resolved by CMB in Figure 4-5 have rather trivial<br />
source profiles (CNG/aged, LPG and biogenics) and therefore are relatively immune to errors<br />
resulting from co-linearity. The skill demonstrated by CMB in Figure 4-5 is in simultaneously<br />
resolving the gasoline, background and diesel contributions despite overlap between profiles for<br />
many species. The CMB apportionment for diesel shows fair correlation with the actual<br />
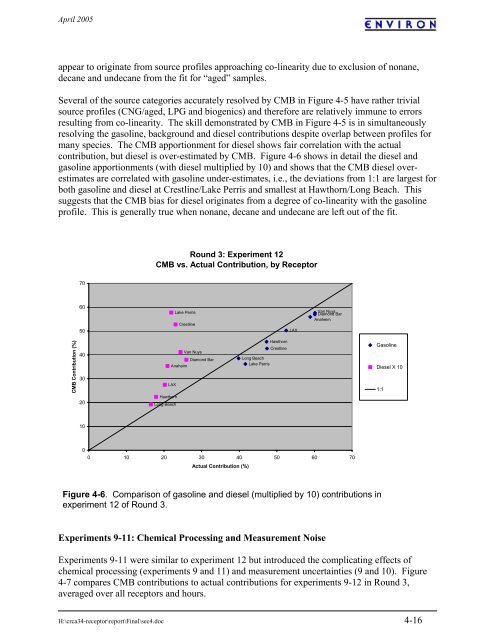
contribution, but diesel is over-estimated by CMB. Figure 4-6 shows in detail the diesel and<br />
gasoline apportionments (with diesel multiplied by 10) and shows that the CMB diesel overestimates<br />
are correlated with gasoline under-estimates, i.e., the deviations from 1:1 are largest for<br />
both gasoline and diesel at Crestline/Lake Perris and smallest at Hawthorn/Long Beach. This<br />
suggests that the CMB bias for diesel originates from a degree of co-linearity with the gasoline<br />
profile. This is generally true when nonane, decane and undecane are left out of the fit.<br />
Round 3: Experiment 12<br />
CMB vs. Actual Contribution, by Receptor<br />
70<br />
60<br />
50<br />
Lake Perris<br />
Crestline<br />
LAX<br />
Van Nuys<br />
Diamond Bar<br />
Anaheim<br />
CMB Contribution (%)<br />
40<br />
30<br />
Van Nuys<br />
Diamond Bar<br />
Anaheim<br />
LAX<br />
Hawthorn<br />
Crestline<br />
Long Beach<br />
Lake Perris<br />
Gasoline<br />
Diesel X 10<br />
1:1<br />
20<br />
Hawthorn<br />
Long Beach<br />
10<br />
0<br />
0 10 20 30 40 50 60 70<br />
Actual Contribution (%)<br />
Figure 4-6. Comparison of gasoline and diesel (multiplied by 10) contributions in<br />
experiment 12 of Round 3.<br />
Experiments 9-11: Chemical Processing and Measurement <strong>No</strong>ise<br />
Experiments 9-11 were similar to experiment 12 but introduced the complicating effects of<br />
chemical processing (experiments 9 and 11) and measurement uncertainties (9 and 10). Figure<br />
4-7 compares CMB contributions to actual contributions for experiments 9-12 in Round 3,<br />
averaged over all receptors and hours.<br />
H:\crca<strong>34</strong>-receptor\report\Final\sec4.doc 4-16


