Flute acoustics: measurement, modelling and design - School of ...
Flute acoustics: measurement, modelling and design - School of ...
Flute acoustics: measurement, modelling and design - School of ...

Create successful ePaper yourself
Turn your PDF publications into a flip-book with our unique Google optimized e-Paper software.
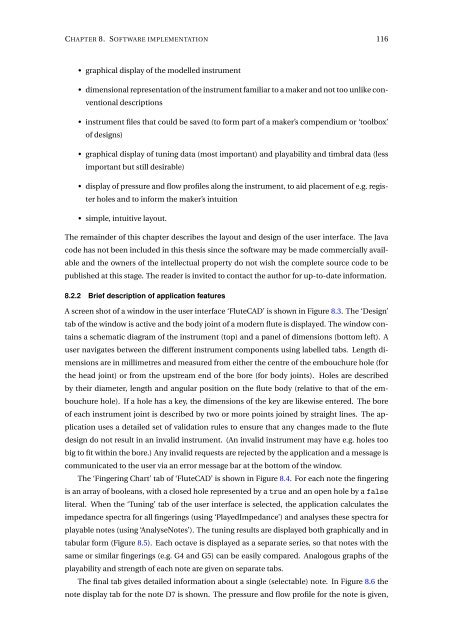
CHAPTER 8. SOFTWARE IMPLEMENTATION 116<br />
• graphical display <strong>of</strong> the modelled instrument<br />
• dimensional representation <strong>of</strong> the instrument familiar to a maker <strong>and</strong> not too unlike conventional<br />
descriptions<br />
• instrument files that could be saved (to form part <strong>of</strong> a maker’s compendium or ‘toolbox’<br />
<strong>of</strong> <strong>design</strong>s)<br />
• graphical display <strong>of</strong> tuning data (most important) <strong>and</strong> playability <strong>and</strong> timbral data (less<br />
important but still desirable)<br />
• display <strong>of</strong> pressure <strong>and</strong> flow pr<strong>of</strong>iles along the instrument, to aid placement <strong>of</strong> e.g. register<br />
holes <strong>and</strong> to inform the maker’s intuition<br />
• simple, intuitive layout.<br />
The remainder <strong>of</strong> this chapter describes the layout <strong>and</strong> <strong>design</strong> <strong>of</strong> the user interface. The Java<br />
code has not been included in this thesis since the s<strong>of</strong>tware may be made commercially available<br />
<strong>and</strong> the owners <strong>of</strong> the intellectual property do not wish the complete source code to be<br />
published at this stage. The reader is invited to contact the author for up-to-date information.<br />
8.2.2 Brief description <strong>of</strong> application features<br />
A screen shot <strong>of</strong> a window in the user interface ‘<strong>Flute</strong>CAD’ is shown in Figure 8.3. The ‘Design’<br />
tab <strong>of</strong> the window is active <strong>and</strong> the body joint <strong>of</strong> a modern flute is displayed. The window contains<br />
a schematic diagram <strong>of</strong> the instrument (top) <strong>and</strong> a panel <strong>of</strong> dimensions (bottom left). A<br />
user navigates between the different instrument components using labelled tabs. Length dimensions<br />
are in millimetres <strong>and</strong> measured from either the centre <strong>of</strong> the embouchure hole (for<br />
the head joint) or from the upstream end <strong>of</strong> the bore (for body joints). Holes are described<br />
by their diameter, length <strong>and</strong> angular position on the flute body (relative to that <strong>of</strong> the embouchure<br />
hole). If a hole has a key, the dimensions <strong>of</strong> the key are likewise entered. The bore<br />
<strong>of</strong> each instrument joint is described by two or more points joined by straight lines. The application<br />
uses a detailed set <strong>of</strong> validation rules to ensure that any changes made to the flute<br />
<strong>design</strong> do not result in an invalid instrument. (An invalid instrument may have e.g. holes too<br />
big to fit within the bore.) Any invalid requests are rejected by the application <strong>and</strong> a message is<br />
communicated to the user via an error message bar at the bottom <strong>of</strong> the window.<br />
The ‘Fingering Chart’ tab <strong>of</strong> ‘<strong>Flute</strong>CAD’ is shown in Figure 8.4. For each note the fingering<br />
is an array <strong>of</strong> booleans, with a closed hole represented by a true <strong>and</strong> an open hole by a false<br />
literal. When the ‘Tuning’ tab <strong>of</strong> the user interface is selected, the application calculates the<br />
impedance spectra for all fingerings (using ‘PlayedImpedance’) <strong>and</strong> analyses these spectra for<br />
playable notes (using ‘AnalyseNotes’). The tuning results are displayed both graphically <strong>and</strong> in<br />
tabular form (Figure 8.5). Each octave is displayed as a separate series, so that notes with the<br />
same or similar fingerings (e.g. G4 <strong>and</strong> G5) can be easily compared. Analogous graphs <strong>of</strong> the<br />
playability <strong>and</strong> strength <strong>of</strong> each note are given on separate tabs.<br />
The final tab gives detailed information about a single (selectable) note. In Figure 8.6 the<br />
note display tab for the note D7 is shown. The pressure <strong>and</strong> flow pr<strong>of</strong>ile for the note is given,