

Weeki Wachee River System Recommended Minimum Flows and ...
Weeki Wachee River System Recommended Minimum Flows and ...
Weeki Wachee River System Recommended Minimum Flows and ...

Create successful ePaper yourself
Turn your PDF publications into a flip-book with our unique Google optimized e-Paper software.
CHAPTER 5 - BIOLOGICAL CHARACTERISTICS<br />
5.1 Benthos<br />
5.1.1 Descriptive<br />
The <strong>Weeki</strong> <strong>Wachee</strong> <strong>and</strong> Mud <strong>River</strong> benthic communities were sampled in 1984-85<br />
(Culter 1986) <strong>and</strong> again during 2005 (Janicki Environmental 2006). In the 1986 study,<br />
Culter sampled using a diver operated box corer (10 replicates per site) at four stations<br />
from 5.8 km 15 offshore up to Rkm 2.4.<br />
In the most recent survey, round h<strong>and</strong> core samplers were used to collect infauna along<br />
fifteen transects in the <strong>Weeki</strong> <strong>Wachee</strong> <strong>and</strong> ten transects in the Mud <strong>River</strong>. Sweep nets<br />
were used to sample the epifauna. The polychaete Laeonereis culveri <strong>and</strong> the<br />
amphipod Gammarus mucronatus were among the dominant epifauna taxa. The<br />
dominant epifaunal taxa consisted of amphipods (Gammarus mucronatus <strong>and</strong><br />
Gr<strong>and</strong>idierella bonnieroides) in both the <strong>Weeki</strong> <strong>and</strong> Mud <strong>River</strong>s. The asellote isopod<br />
Uronmunna reynoldsi was also dominant in the <strong>Weeki</strong> <strong>Wachee</strong> but not the Mud <strong>River</strong>.<br />
In contrast, the tanaid Hareria rapax <strong>and</strong> the mysid Taphromysis bowmani were among<br />
the top ten dominants in the Mud <strong>River</strong> but were not ranked in the <strong>Weeki</strong> <strong>Wachee</strong>.<br />
5.1.2 Relation to inflow<br />
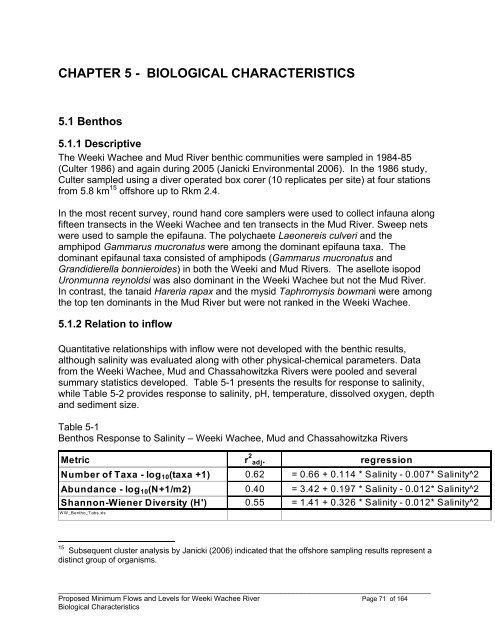
Quantitative relationships with inflow were not developed with the benthic results,<br />
although salinity was evaluated along with other physical-chemical parameters. Data<br />
from the <strong>Weeki</strong> <strong>Wachee</strong>, Mud <strong>and</strong> Chassahowitzka <strong>River</strong>s were pooled <strong>and</strong> several<br />
summary statistics developed. Table 5-1 presents the results for response to salinity,<br />
while Table 5-2 provides response to salinity, pH, temperature, dissolved oxygen, depth<br />
<strong>and</strong> sediment size.<br />
Table 5-1<br />
Benthos Response to Salinity – <strong>Weeki</strong> <strong>Wachee</strong>, Mud <strong>and</strong> Chassahowitzka <strong>River</strong>s<br />
Metric r 2 adj. regression<br />
Number of Taxa - log 10 (taxa +1) 0.62 = 0.66 + 0.114 * Salinity - 0.007* Salinity^2<br />
Abundance - log 10 (N+1/m2) 0.40 = 3.42 + 0.197 * Salinity - 0.012* Salinity^2<br />
Shannon-Wiener Diversity (H') 0.55 = 1.41 + 0.326 * Salinity - 0.012* Salinity^2<br />
WW_Bentho_Tabs.xls<br />
15 Subsequent cluster analysis by Janicki (2006) indicated that the offshore sampling results represent a<br />
distinct group of organisms.<br />
____________________________________________________________________________________________<br />
Proposed <strong>Minimum</strong> <strong>Flows</strong> <strong>and</strong> Levels for <strong>Weeki</strong> <strong>Wachee</strong> <strong>River</strong> Page 71 of 164<br />
Biological Characteristics


