KARRINYUP / GWELUP Local Area Plan - City of Stirling
KARRINYUP / GWELUP Local Area Plan - City of Stirling
KARRINYUP / GWELUP Local Area Plan - City of Stirling

Create successful ePaper yourself
Turn your PDF publications into a flip-book with our unique Google optimized e-Paper software.
In 2006, the average age <strong>of</strong> residents in the Karrinyup-Gwelup<br />
<strong>Local</strong> <strong>Area</strong> was 39 years <strong>of</strong> age and 19.1% <strong>of</strong> the population was<br />
aged 60 years or older. The median age and the proportion <strong>of</strong><br />
seniors were higher than the <strong>City</strong> <strong>of</strong> <strong>Stirling</strong> or Metropolitan Perth<br />
averages.<br />
A significant proportion (74.9%) <strong>of</strong> the 2006 population form family<br />
households - well above the <strong>City</strong> <strong>of</strong> <strong>Stirling</strong> and Perth metropolitan<br />
averages. Of these family households, 49% were couples with<br />
children, 39.6% were couples with no children and 10.1% were<br />
single parent families. These figures indicate that the Karrinyup-<br />
Gwelup <strong>Local</strong> <strong>Area</strong> is not consistent with averages across most<br />
areas <strong>of</strong> Perth and <strong>Stirling</strong>, where the proportion <strong>of</strong> couples<br />
without children and people living alone has been increasing for<br />
many years. Of all occupied private dwellings within the <strong>Local</strong><br />
<strong>Area</strong>, 20.2% are lone households. This is much lower than the<br />
<strong>City</strong> <strong>of</strong> <strong>Stirling</strong> average, although only slightly less than the Perth<br />
average.<br />
Percentage <strong>of</strong> Population<br />
20<br />
18<br />
16<br />
14<br />
12<br />
10<br />
8<br />
6<br />
4<br />
2<br />
0<br />
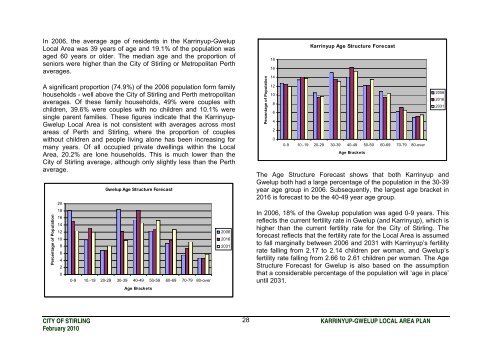
Gwelup Age Structure Forecast<br />
0-9 10.-19 20-29 30-39 40-49 50-59 60-69 70-79 80-over<br />
Age Brackets<br />
2006<br />
2016<br />
2031<br />
Percentage <strong>of</strong> Population<br />
18<br />
16<br />
14<br />
12<br />
10<br />
8<br />
6<br />
4<br />
2<br />
0<br />
Karrinyup Age Structure Forecast<br />
0-9 10.-19 20-29 30-39 40-49 50-59 60-69 70-79 80-over<br />
Age Brackets<br />
The Age Structure Forecast shows that both Karrinyup and<br />
Gwelup both had a large percentage <strong>of</strong> the population in the 30-39<br />
year age group in 2006. Subsequently, the largest age bracket in<br />
2016 is forecast to be the 40-49 year age group.<br />
In 2006, 18% <strong>of</strong> the Gwelup population was aged 0-9 years. This<br />
reflects the current fertility rate in Gwelup (and Karrinyup), which is<br />
higher than the current fertility rate for the <strong>City</strong> <strong>of</strong> <strong>Stirling</strong>. The<br />
forecast reflects that the fertility rate for the <strong>Local</strong> <strong>Area</strong> is assumed<br />
to fall marginally between 2006 and 2031 with Karrinyup’s fertility<br />
rate falling from 2.17 to 2.14 children per woman, and Gwelup’s<br />
fertility rate falling from 2.66 to 2.61 children per woman. The Age<br />
Structure Forecast for Gwelup is also based on the assumption<br />
that a considerable percentage <strong>of</strong> the population will ‘age in place’<br />
until 2031.<br />
2006<br />
2016<br />
2031<br />
CITY OF STIRLING 28<br />
<strong>KARRINYUP</strong>-<strong>GWELUP</strong> LOCAL AREA PLAN<br />
February 2010