Opportunities for the smallholder sandalwood industry in ... - ACIAR
Opportunities for the smallholder sandalwood industry in ... - ACIAR
Opportunities for the smallholder sandalwood industry in ... - ACIAR

You also want an ePaper? Increase the reach of your titles
YUMPU automatically turns print PDFs into web optimized ePapers that Google loves.
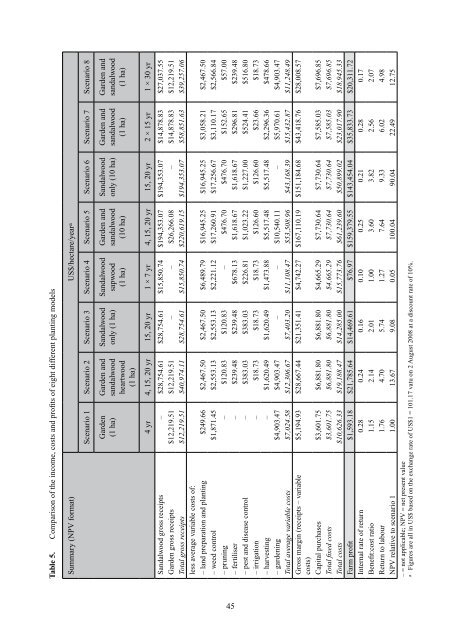
Table 5. Comparison of <strong>the</strong> <strong>in</strong>come, costs and profits of eight different plant<strong>in</strong>g models<br />
Summary (NPV <strong>for</strong>mat) US$/hectare/year a<br />
Scenario 1 Scenario 2 Scenario 3 Scenario 4 Scenario 5 Scenario 6 Scenario 7 Scenario 8<br />
Garden<br />
(1 ha)<br />
Garden and<br />
<strong>sandalwood</strong><br />
heartwood<br />
(1 ha)<br />
Sandalwood<br />
only (1 ha)<br />
Sandalwood<br />
sapwood<br />
(1 ha)<br />
Garden and<br />
<strong>sandalwood</strong><br />
(10 ha)<br />
Sandalwood<br />
only (10 ha)<br />
Garden and<br />
<strong>sandalwood</strong><br />
(1 ha)<br />
Garden and<br />
<strong>sandalwood</strong><br />
(1 ha)<br />
4 yr 4, 15, 20 yr 15, 20 yr 1 × 7 yr 4, 15, 20 yr 15, 20 yr 2 × 15 yr 1 × 30 yr<br />
Sandalwood gross receipts – $28,754.61 $28,754.61 $15,850.74 $194,353.07 $194,353.07 $14,878.83 $27,037.55<br />
Garden gross receipts $12,219.51 $12,219.51 – – $26,266.08 – $14,878.83 $12,219.51<br />
Total gross receipts $12,219.51 $40,974.11 $28,754.61 $15,850.74 $220,619.15 $194,353.07 $58,851.63 $39,257.06<br />
less average variable costs of:<br />
– land preparation and plant<strong>in</strong>g $249.66 $2,467.50 $2,467.50 $6,489.79 $16,945.25 $16,945.25 $3,058.21 $2,467.50<br />
– weed control $1,871.45 $2,553.13 $2,553.13 $2,221.12 $17,260.91 $17,256.67 $3,110.17 $2,566.84<br />
– prun<strong>in</strong>g – $120.83 $120.83 – $476.70 $476.70 $152.65 $57.00<br />
– fertiliser – $239.48 $239.48 $678.13 $1,618.67 $1,618.67 $296.81 $239.48<br />
– pest and disease control – $383.03 $383.03 $226.81 $1,023.22 $1,227.00 $524.41 $516.80<br />
– irrigation – $18.73 $18.73 $18.73 $126.60 $126.60 $23.66 $18.73<br />
– harvest<strong>in</strong>g – $1,620.49 $1,620.49 $1,473.88 $5,517.48 $5,517.48 $2,296.36 $478.66<br />
– garden<strong>in</strong>g $4,903.47 $4,903.47 – – $10,540.11 – $5,970.61 $4,903.47<br />
Total average variable costs $7,024.58 $12,306.67 $7,403.20 $11,108.47 $53,508.96 $43,168.39 $15,432.87 $11,248.49<br />
Gross marg<strong>in</strong> (receipts – variable $5,194.93 $28,667.44 $21,351.41 $4,742.27 $167,110.19 $151,184.68 $43,418.76 $28,008.57<br />
costs)<br />
Capital purchases $3,601.75 $6,881.80 $6,881.80 $4,665.29 $7,730.64 $7,730.64 $7,585.03 $7,696.85<br />
Total fixed costs $3,601.75 $6,881.80 $6,881.80 $4,665.29 $7,730.64 $7,730.64 $7,585.03 $7,696.85<br />
Total costs $10,626.33 $19,188.47 $14,285.00 $15,773.76 $61,239.60 $50,899.02 $23,017.90 $18,945.33<br />
Farm profit $1,593.18 $21,785.64 $14,469.61 $76.97 $159,379.55 $143,454.04 $35,833.73 $20,311.72<br />
Internal rate of return 0.28 0.24 0.16 0.10 0.25 0.21 0.28 0.17<br />
Benefit:cost ratio 1.15 2.14 2.01 1.00 3.60 3.82 2.56 2.07<br />
Return to labour 1.76 4.70 5.74 1.27 7.64 9.33 6.02 4.98<br />
NPV relative to scenario 1 1.00 13.67 9.08 0.05 100.04 90.04 22.49 12.75<br />
– = not applicable; NPV = net present value<br />
a Figures are all <strong>in</strong> US$ based on <strong>the</strong> exchange rate of US$1 = 101.17 vatu on 2 August 2008 at a discount rate of 10%.<br />
45