notes to the financial statements - Food Empire Holdings Limited
notes to the financial statements - Food Empire Holdings Limited
notes to the financial statements - Food Empire Holdings Limited

You also want an ePaper? Increase the reach of your titles
YUMPU automatically turns print PDFs into web optimized ePapers that Google loves.
<strong>Food</strong> <strong>Empire</strong> <strong>Holdings</strong> <strong>Limited</strong> Annual Report 2012<br />
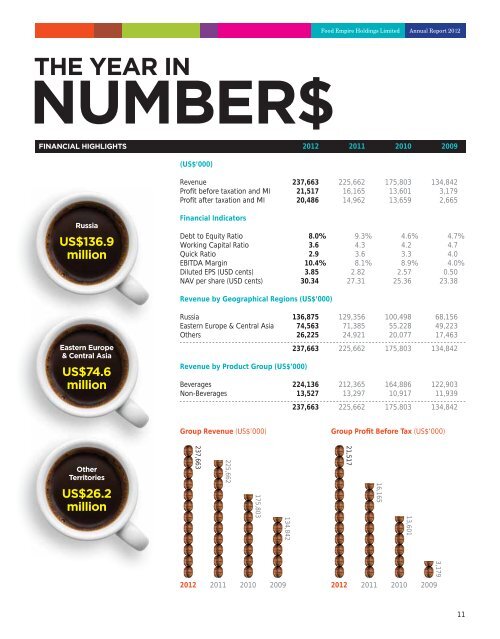
THE YEAR IN<br />
NUMBER$<br />
FINANCIAL HIGHLIGHTS<br />
2012 2011 2010 2009<br />
(US$’000)<br />
Revenue 237,663 225,662 175,803 134,842<br />
Profit before taxation and MI 21,517 16,165 13,601 3,179<br />
Profit after taxation and MI 20,486 14,962 13,659 2,665<br />
Russia<br />
US$136.9<br />
million<br />
Financial Indica<strong>to</strong>rs<br />
Debt <strong>to</strong> Equity Ratio 8.0% 9.3% 4.6% 4.7%<br />
Working Capital Ratio 3.6 4.3 4.2 4.7<br />
Quick Ratio 2.9 3.6 3.3 4.0<br />
EBITDA Margin 10.4% 8.1% 8.9% 4.0%<br />
Diluted EPS (USD cents) 3.85 2.82 2.57 0.50<br />
NAV per share (USD cents) 30.34 27.31 25.36 23.38<br />
Revenue by Geographical Regions (US$’000)<br />
Eastern Europe<br />
& Central Asia<br />
US$74.6<br />
million<br />
Russia 136,875 129,356 100,498 68,156<br />
Eastern Europe & Central Asia 74,563 71,385 55,228 49,223<br />
O<strong>the</strong>rs 26,225 24,921 20,077 17,463<br />
237,663 225,662 175,803 134,842<br />
Revenue by Product Group (US$’000)<br />
Beverages 224,136 212,365 164,886 122,903<br />
Non-Beverages 13,527 13,297 10,917 11,939<br />
237,663 225,662 175,803 134,842<br />
Group Revenue (US$’000)<br />
Group Profit Before Tax (US$’000)<br />
O<strong>the</strong>r<br />
Terri<strong>to</strong>ries<br />
US$26.2<br />
million<br />
237,663<br />
225,662<br />
175,803<br />
134,842<br />
21,517<br />
16,165<br />
13,601<br />
2012 2011 2010 2009<br />
2012 2011 2010 2009<br />
3,179<br />
11