industry and environment - DTIE
industry and environment - DTIE
industry and environment - DTIE

You also want an ePaper? Increase the reach of your titles
YUMPU automatically turns print PDFs into web optimized ePapers that Google loves.
Chemicals management<br />
have been widely acknowledged to be a<br />
useful but under-utilized tool for achieving<br />
<strong>environment</strong>al goals. At the same time,<br />
<strong>environment</strong>al policy has been straining to<br />
prevent <strong>environment</strong>al damage instead of<br />
repairing it. The real connection between<br />
these two ideas has not yet been made.<br />
Mexico relies heavily on comm<strong>and</strong> <strong>and</strong><br />
control policies. It is argued by <strong>environment</strong>alists<br />
(supporting government officials<br />
<strong>and</strong> <strong>industry</strong> lobbies) that these<br />
policies provide greater certainty of <strong>environment</strong>al<br />
outcomes <strong>and</strong> are less expensive<br />
for complying firms. Nevertheless, we<br />
strongly believe that the flexibility <strong>and</strong> efficiency<br />
of economic instruments in middleincome<br />
countries like Mexico should not<br />
be underestimated. In the case of pesticides,<br />
this means acting in the grey area<br />
where the case for prohibiting substances is<br />
not strong but doing nothing is not desirable<br />
either.<br />
Among Organisation for Economic<br />
Cooperation <strong>and</strong> Development (OECD)<br />
countries, Denmark, Sweden, France <strong>and</strong><br />
Norway have successfully introduced a levy<br />
on pesticides where there is some degree of<br />
differentiation according to toxicity. Arie<br />
Oskam (1997) summarizes (using three<br />
basic points) the main lessons from the<br />
international experience concerning how<br />
to design a successful levy on pesticides:<br />
1. Levies should be set according to the<br />
health or <strong>environment</strong>al damage pesticides<br />
cause. The most hazardous substances<br />
should be subject to the highest tax rate. If<br />
possible, taxes should be set with reference to the<br />
economic value of the marginal externality (social)<br />
cost.<br />
2. The levy should have adequate means of collection<br />
<strong>and</strong> be fraud-proof. The main effect of<br />
substitution will be lost if more toxic substances<br />
are taxed less.<br />
3. Reimbursing revenues from the levy to farmers<br />
in a neutral way increases the measure’s political<br />
acceptability, but this must be done using a mechanism<br />
with low transaction costs.<br />
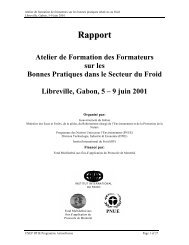
Figure 1<br />
Pesticide market according to main crops treated<br />
(1992 data)<br />
banana, 1.9%<br />
citrus, 2.5%<br />
beans, 2.7%<br />
cane, 2.7%<br />
tobacco, 3.1%<br />
soy, 5.2%<br />
potato<br />
6.2%<br />
chile<br />
7.2%<br />
cotton<br />
7.3%<br />
corn<br />
15.4%<br />
tomato<br />
12.1%<br />
other<br />
vegetables<br />
11%<br />
melon<br />
7.9% other non-vegetables, 14.6%<br />
Source: Asociación Mexicana de la Industria de Plaguicidas y Fertilizantes, November 1993<br />
Table 1<br />
Types of pesticides <strong>and</strong> scenarios for<br />
<strong>environment</strong>al taxes<br />
WHO classification Share of sales Environmental tax (%)<br />
of pesticides<br />
in Mexico<br />
2003 (%) Option 1 Option 2 Option 3<br />
WHO Ia-Ib (highest toxicity) 17 15 15 10<br />
WHO II (high toxicity) 44 15 10 0<br />
WHO III (medium toxicity) 21 15 5 0<br />
WHO IV (low toxicity) 18 15 0 0<br />
Total 100<br />
Source: Survey on local sales of pesticides, Instituto Nacional de Ecología, 2003<br />
The amount of the tax is another issue. There<br />
are as yet no studies that monetize the value of<br />
<strong>environment</strong>al damage caused by pesticides in<br />
Mexico. Total internalization of this cost through<br />
the tax cannot be achieved. Thus, we follow a simpler<br />
rule. Given that pesticides are exempt from<br />
the 15% VAT, we set the highest tax level at 15%<br />
<strong>and</strong> the lowest at 0%, allowing for the largest possible<br />
variation. Table 1 summarizes the three<br />
options analyzed. The first option is the equivalent<br />
of eliminating the VAT exemption. The main<br />
drawback of this option is that it does not<br />
discriminate among substances that are<br />
less or more harmful. Although it strongly<br />
reduces pesticide use, there is very little<br />
change in the shares of the types of pesticides<br />
used. The second option is a gradual<br />
reduction of the tax, leaving only the best<br />
pesticides (from an <strong>environment</strong>al point<br />
of view) exempt. With the third option,<br />
the worst pesticides are taxed at 10%, leaving<br />
the rest exempt.<br />
The tax would be applicable to all manufacturers<br />
or importers of the basic pesticides.<br />
If mixes were prepared (to be placed on the<br />
market as different products), the <strong>environment</strong>al<br />
tax would not be applied twice.<br />
Costs to producers <strong>and</strong><br />
consumers<br />
Introducing an <strong>environment</strong>al tax on pesticides<br />
in Mexico would increase the costs<br />
to agricultural producers. Depending on<br />
elasticity of supply <strong>and</strong> dem<strong>and</strong>, producers<br />
would pass on some of the increase to<br />
consumers. This section considers one of<br />
the extremes (i.e. when all costs are passed<br />
on to consumers) <strong>and</strong> estimates price<br />
increases for each tax option. The next section<br />
will demonstrate how different elasticities<br />
of dem<strong>and</strong> would actually change<br />
patterns of pesticide use (one of the policy’s<br />
stated objectives).<br />
Table 2 shows production costs <strong>and</strong> net<br />
income for key crops in Mexico, selected<br />
because for their volume, such as corn<br />
(maize) <strong>and</strong> beans, or because of their<br />
importance as exports (e.g. tomatoes). Expenditure<br />
on pesticides varies widely (also see Figure 1).<br />
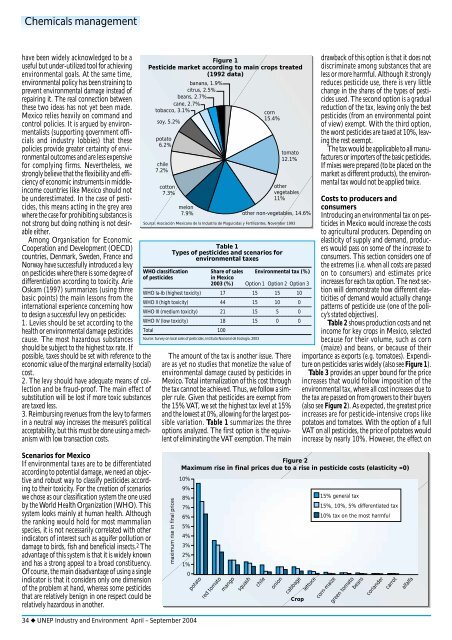
Table 3 provides an upper bound for the price<br />
increases that would follow imposition of the<br />
<strong>environment</strong>al tax, where all cost increases due to<br />
the tax are passed on from growers to their buyers<br />
(also see Figure 2). As expected, the greatest price<br />
increases are for pesticide-intensive crops like<br />
potatoes <strong>and</strong> tomatoes. With the option of a full<br />
VAT on all pesticides, the price of potatoes would<br />
increase by nearly 10%. However, the effect on<br />
Scenarios for Mexico<br />
If <strong>environment</strong>al taxes are to be differentiated<br />
according to potential damage, we need an objective<br />
<strong>and</strong> robust way to classify pesticides according<br />
to their toxicity. For the creation of scenarios<br />
we chose as our classification system the one used<br />
by the World Health Organization (WHO). This<br />
system looks mainly at human health. Although<br />
the ranking would hold for most mammalian<br />
species, it is not necessarily correlated with other<br />
indicators of interest such as aquifer pollution or<br />
damage to birds, fish <strong>and</strong> beneficial insects. 2 The<br />
advantage of this system is that it is widely known<br />
<strong>and</strong> has a strong appeal to a broad constituency.<br />
Of course, the main disadvantage of using a single<br />
indicator is that it considers only one dimension<br />
of the problem at h<strong>and</strong>, whereas some pesticides<br />
that are relatively benign in one respect could be<br />
relatively hazardous in another.<br />
maximum rise in final prices<br />
Figure 2<br />
Maximum rise in final prices due to a rise in pesticide costs (elasticity =0)<br />
10%<br />
9%<br />
8%<br />
7%<br />
6%<br />
5%<br />
4%<br />
3%<br />
2%<br />
1%<br />
0<br />
potato<br />
red tomato<br />
mango<br />
squash<br />
chile<br />
onion<br />
cabbage<br />
lettuce<br />
Crop<br />
15% general tax<br />
15%, 10%, 5% differentiated tax<br />
10% tax on the most harmful<br />
corn-maize<br />
green tomato<br />
beans<br />
cori<strong>and</strong>er<br />
carrot<br />
alfalfa<br />
34 ◆ UNEP Industry <strong>and</strong> Environment April – September 2004