The Effect of Peening on the Fatigue Life of 7050 Aluminium Alloy
The Effect of Peening on the Fatigue Life of 7050 Aluminium Alloy
The Effect of Peening on the Fatigue Life of 7050 Aluminium Alloy

Create successful ePaper yourself
Turn your PDF publications into a flip-book with our unique Google optimized e-Paper software.
DSTO-RR-0208<br />
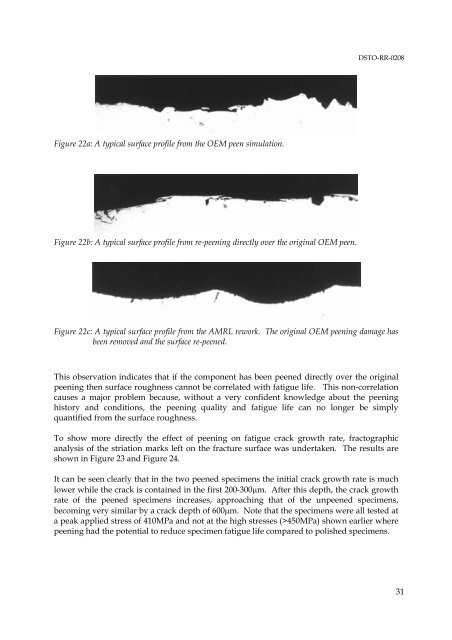
Figure 22a: A typical surface pr<str<strong>on</strong>g>of</str<strong>on</strong>g>ile from <strong>the</strong> OEM peen simulati<strong>on</strong>.<br />
Figure 22b: A typical surface pr<str<strong>on</strong>g>of</str<strong>on</strong>g>ile from re-peening directly over <strong>the</strong> original OEM peen.<br />
Figure 22c: A typical surface pr<str<strong>on</strong>g>of</str<strong>on</strong>g>ile from <strong>the</strong> AMRL rework. <str<strong>on</strong>g>The</str<strong>on</strong>g> original OEM peening damage has<br />
been removed and <strong>the</strong> surface re-peened.<br />
This observati<strong>on</strong> indicates that if <strong>the</strong> comp<strong>on</strong>ent has been peened directly over <strong>the</strong> original<br />
peening <strong>the</strong>n surface roughness cannot be correlated with fatigue life. This n<strong>on</strong>-correlati<strong>on</strong><br />
causes a major problem because, without a very c<strong>on</strong>fident knowledge about <strong>the</strong> peening<br />
history and c<strong>on</strong>diti<strong>on</strong>s, <strong>the</strong> peening quality and fatigue life can no l<strong>on</strong>ger be simply<br />
quantified from <strong>the</strong> surface roughness.<br />
To show more directly <strong>the</strong> effect <str<strong>on</strong>g>of</str<strong>on</strong>g> peening <strong>on</strong> fatigue crack growth rate, fractographic<br />
analysis <str<strong>on</strong>g>of</str<strong>on</strong>g> <strong>the</strong> striati<strong>on</strong> marks left <strong>on</strong> <strong>the</strong> fracture surface was undertaken. <str<strong>on</strong>g>The</str<strong>on</strong>g> results are<br />
shown in Figure 23 and Figure 24.<br />
It can be seen clearly that in <strong>the</strong> two peened specimens <strong>the</strong> initial crack growth rate is much<br />
lower while <strong>the</strong> crack is c<strong>on</strong>tained in <strong>the</strong> first 200-300µm. After this depth, <strong>the</strong> crack growth<br />
rate <str<strong>on</strong>g>of</str<strong>on</strong>g> <strong>the</strong> peened specimens increases, approaching that <str<strong>on</strong>g>of</str<strong>on</strong>g> <strong>the</strong> unpeened specimens,<br />
becoming very similar by a crack depth <str<strong>on</strong>g>of</str<strong>on</strong>g> 600µm. Note that <strong>the</strong> specimens were all tested at<br />
a peak applied stress <str<strong>on</strong>g>of</str<strong>on</strong>g> 410MPa and not at <strong>the</strong> high stresses (>450MPa) shown earlier where<br />
peening had <strong>the</strong> potential to reduce specimen fatigue life compared to polished specimens.<br />
31