The Effect of Peening on the Fatigue Life of 7050 Aluminium Alloy
The Effect of Peening on the Fatigue Life of 7050 Aluminium Alloy
The Effect of Peening on the Fatigue Life of 7050 Aluminium Alloy

You also want an ePaper? Increase the reach of your titles
YUMPU automatically turns print PDFs into web optimized ePapers that Google loves.
DSTO-RR-0208<br />
Like all <strong>the</strong> structural aluminium parts <strong>the</strong> Y470.5 bulkhead has been IVD coated for<br />
corrosi<strong>on</strong> protecti<strong>on</strong>. As part <str<strong>on</strong>g>of</str<strong>on</strong>g> this IVD producti<strong>on</strong> process <strong>the</strong> fresh aluminium surface is<br />
etched. This etching has a detrimental effect <strong>on</strong> <strong>the</strong> fatigue life <str<strong>on</strong>g>of</str<strong>on</strong>g> coup<strong>on</strong>s made from a<br />
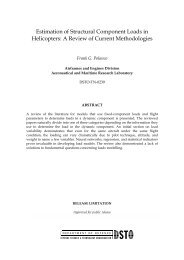
similar material <strong>7050</strong>-T7451 (Barter 1999). A comparis<strong>on</strong> <str<strong>on</strong>g>of</str<strong>on</strong>g> peened fatigue life versus etch<br />
fatigue life, Figure 32, shows <strong>the</strong> benefit <str<strong>on</strong>g>of</str<strong>on</strong>g> peening compared to an etched surface over a<br />
large range <str<strong>on</strong>g>of</str<strong>on</strong>g> stresses.<br />
Etched <strong>Fatigue</strong> <strong>Life</strong><br />
Peened <strong>Fatigue</strong> <strong>Life</strong><br />
500<br />
450<br />
Max Stress (MPa)<br />
400<br />
350<br />
300<br />
250<br />
0 50 100 150 200 250 300 350 400<br />
IARP03a programs<br />
Figure 32: <strong>Fatigue</strong> test results using IARP03a+marker spectrum comparing an etched surface finish<br />
with a peened surface finish. <str<strong>on</strong>g>The</str<strong>on</strong>g> peening was d<strong>on</strong>e as per AMRL standards.<br />
All testing was d<strong>on</strong>e under spectrum loading using a fighter aircraft representative spectrum<br />
(IARPO3a), which equates to approximately <strong>on</strong>e year <str<strong>on</strong>g>of</str<strong>on</strong>g> flying. This is <strong>the</strong> spectrum applied<br />
to <strong>the</strong> FT55 fatigue test and FT488/2 bulkhead fatigue test.<br />
<str<strong>on</strong>g>The</str<strong>on</strong>g> crack growth rate and initial disc<strong>on</strong>tinuity size were measured for each specimen. This<br />
provided a distributi<strong>on</strong> <str<strong>on</strong>g>of</str<strong>on</strong>g> fatigue initiati<strong>on</strong> starter sizes (“y” intercept in Figure 33) and crack<br />
growth rates (slopes in Figure 33). For a particular stress <strong>the</strong> fatigue crack growth rate<br />
showed very little variati<strong>on</strong>, <strong>the</strong>refore <strong>on</strong>ly <strong>the</strong> mean slope was used for all subsequent<br />
analysis. By using <strong>the</strong> distributi<strong>on</strong> <str<strong>on</strong>g>of</str<strong>on</strong>g> fatigue starters and <strong>the</strong> mean crack growth rate, Figure<br />
33, it is possible to determine <strong>the</strong> status <str<strong>on</strong>g>of</str<strong>on</strong>g> each aircraft and <strong>the</strong> repair procedure needed.<br />
42