2030 Plan - Grand Strand Water and Sewer Authority
2030 Plan - Grand Strand Water and Sewer Authority
2030 Plan - Grand Strand Water and Sewer Authority

Create successful ePaper yourself
Turn your PDF publications into a flip-book with our unique Google optimized e-Paper software.
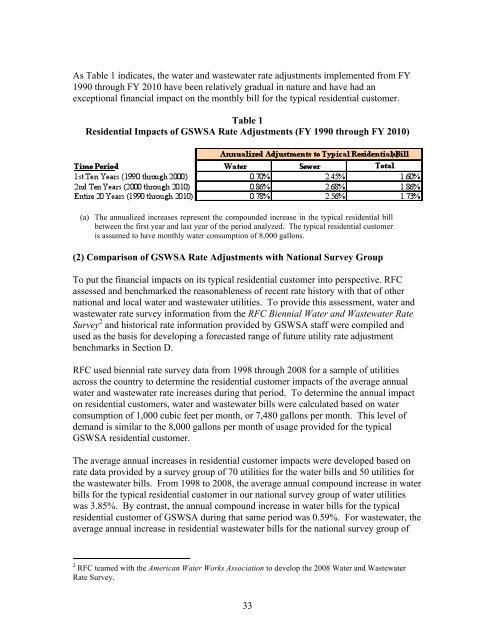
As Table 1 indicates, the water <strong>and</strong> wastewater rate adjustments implemented from FY<br />
1990 through FY 2010 have been relatively gradual in nature <strong>and</strong> have had an<br />
exceptional financial impact on the monthly bill for the typical residential customer.<br />
Table 1<br />
Residential Impacts of GSWSA Rate Adjustments (FY 1990 through FY 2010)<br />
(a) The annualized increases represent the compounded increase in the typical residential bill<br />
between the first year <strong>and</strong> last year of the period analyzed. The typical residential customer<br />
is assumed to have monthly water consumption of 8,000 gallons.<br />
(2) Comparison of GSWSA Rate Adjustments with National Survey Group<br />
To put the financial impacts on its typical residential customer into perspective. RFC<br />
assessed <strong>and</strong> benchmarked the reasonableness of recent rate history with that of other<br />
national <strong>and</strong> local water <strong>and</strong> wastewater utilities. To provide this assessment, water <strong>and</strong><br />
wastewater rate survey information from the RFC Biennial <strong>Water</strong> <strong>and</strong> Wastewater Rate<br />
Survey 2 <strong>and</strong> historical rate information provided by GSWSA staff were compiled <strong>and</strong><br />
used as the basis for developing a forecasted range of future utility rate adjustment<br />
benchmarks in Section D.<br />
RFC used biennial rate survey data from 1998 through 2008 for a sample of utilities<br />
across the country to determine the residential customer impacts of the average annual<br />
water <strong>and</strong> wastewater rate increases during that period. To determine the annual impact<br />
on residential customers, water <strong>and</strong> wastewater bills were calculated based on water<br />
consumption of 1,000 cubic feet per month, or 7,480 gallons per month. This level of<br />
dem<strong>and</strong> is similar to the 8,000 gallons per month of usage provided for the typical<br />
GSWSA residential customer.<br />
The average annual increases in residential customer impacts were developed based on<br />
rate data provided by a survey group of 70 utilities for the water bills <strong>and</strong> 50 utilities for<br />
the wastewater bills. From 1998 to 2008, the average annual compound increase in water<br />
bills for the typical residential customer in our national survey group of water utilities<br />
was 3.85%. By contrast, the annual compound increase in water bills for the typical<br />
residential customer of GSWSA during that same period was 0.59%. For wastewater, the<br />
average annual increase in residential wastewater bills for the national survey group of<br />
<br />
2 RFC teamed with the American <strong>Water</strong> Works Association to develop the 2008 <strong>Water</strong> <strong>and</strong> Wastewater<br />
Rate Survey.<br />
33