Watershed Management Plan - Mason County
Watershed Management Plan - Mason County
Watershed Management Plan - Mason County

Create successful ePaper yourself
Turn your PDF publications into a flip-book with our unique Google optimized e-Paper software.
Appendix<br />
A Sub-basin Summaries<br />
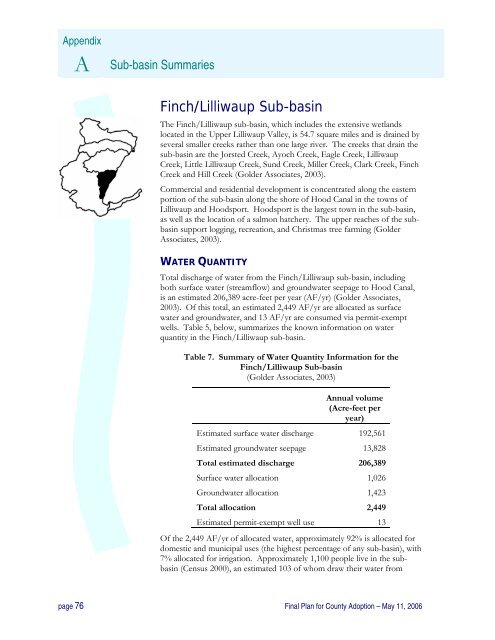
Finch/Lilliwaup Sub-basin<br />
The Finch/Lilliwaup sub-basin, which includes the extensive wetlands<br />
located in the Upper Lilliwaup Valley, is 54.7 square miles and is drained by<br />
several smaller creeks rather than one large river. The creeks that drain the<br />
sub-basin are the Jorsted Creek, Ayoch Creek, Eagle Creek, Lilliwaup<br />
Creek, Little Lilliwaup Creek, Sund Creek, Miller Creek, Clark Creek, Finch<br />
Creek and Hill Creek (Golder Associates, 2003).<br />
Commercial and residential development is concentrated along the eastern<br />
portion of the sub-basin along the shore of Hood Canal in the towns of<br />
Lilliwaup and Hoodsport. Hoodsport is the largest town in the sub-basin,<br />
as well as the location of a salmon hatchery. The upper reaches of the subbasin<br />
support logging, recreation, and Christmas tree farming (Golder<br />
Associates, 2003).<br />
WATER QUANTITY<br />
Total discharge of water from the Finch/Lilliwaup sub-basin, including<br />
both surface water (streamflow) and groundwater seepage to Hood Canal,<br />
is an estimated 206,389 acre-feet per year (AF/yr) (Golder Associates,<br />
2003). Of this total, an estimated 2,449 AF/yr are allocated as surface<br />
water and groundwater, and 13 AF/yr are consumed via permit-exempt<br />
wells. Table 5, below, summarizes the known information on water<br />
quantity in the Finch/Lilliwaup sub-basin.<br />
Table 7. Summary of Water Quantity Information for the<br />
Finch/Lilliwaup Sub-basin<br />
(Golder Associates, 2003)<br />
Annual volume<br />
(Acre-feet per<br />
year)<br />
Estimated surface water discharge 192,561<br />
Estimated groundwater seepage 13,828<br />
Total estimated discharge 206,389<br />
Surface water allocation 1,026<br />
Groundwater allocation 1,423<br />
Total allocation 2,449<br />
Estimated permit-exempt well use 13<br />
Of the 2,449 AF/yr of allocated water, approximately 92% is allocated for<br />
domestic and municipal uses (the highest percentage of any sub-basin), with<br />
7% allocated for irrigation. Approximately 1,100 people live in the subbasin<br />
(Census 2000), an estimated 103 of whom draw their water from<br />
page 76 Final <strong>Plan</strong> for <strong>County</strong> Adoption – May 11, 2006