IMProVe 2011 - Proceedings
IMProVe 2011 - Proceedings
IMProVe 2011 - Proceedings

Create successful ePaper yourself
Turn your PDF publications into a flip-book with our unique Google optimized e-Paper software.
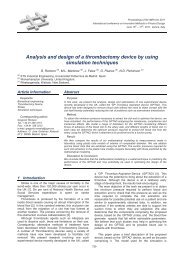
Representation Techniques<br />
Main axonometric system related views as tilt<br />
of the coordinate planes<br />
L. Gimena (a), P. Gonzaga (a), F. N. Gimena (a)<br />
(a) Department of Projects Engineering. Public University of Navarra<br />
Abstract:<br />
In this communication we start both from a trirectangular trihedral defined by the three<br />
coordinate planes and a fourth plane, called the chart or projection, which contains the<br />
vertex of the trihedral above. Later we define the main related views or trihedral views as<br />
those produced by the tilt of the three coordinate planes to the outside of their trihedral<br />
on the chart plane. For each projection plane there are some unique main related views,<br />
regardless of the projection direction. In turn, from the trihedral views we can obtain the<br />
axonometric perspective from which they come. These properties can simplify some<br />
graphic constructions of the axonometric system, for example, determine the projections<br />
of the axes from the main related views or determine the axonometric scales from the<br />
axes. It is considered that this new definition of trihedral views allows a simplification as to<br />
the understanding of the systems of representation and is intended to be suitable for<br />
teaching purposes.<br />
Keywords: Axonometric, Related views, Coordinate planes<br />
Corresponding Author: Faustino N. Gimena<br />
Tel.: +34 948 169 225<br />
e-mail: faustino@unavarra.es<br />
Address: Campus de Arrosadía, s/n. 31006 Pamplona. Spain.<br />
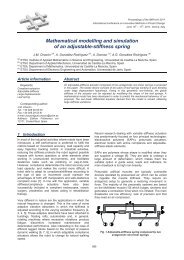
Parameter Combinatorial Diagram.<br />
Application to the study and analysis<br />
of Hydrological Simulation Models.<br />
M. Goñi (a), J. Javier López (a), F. N. Gimena (a)<br />
(a) Department of Projects Engineering. Public University of Navarre.<br />
Abstract:<br />
In this paper we define Parameter Combinatorial Diagram as the joint graphical<br />
representation of all box plots related to the adjustment between real and simulated data,<br />
by setting and / or changing the parameters of the simulation model. To do this, first we<br />
start with a box plot representing the values of an objective adjustment function,<br />
achieving these results when varying all the parameters of the simulation model. Then we<br />
June 15 th – 17 th , <strong>2011</strong>, Venice, Italy<br />
124<br />
<strong>IMProVe</strong> <strong>2011</strong> - <strong>Proceedings</strong>